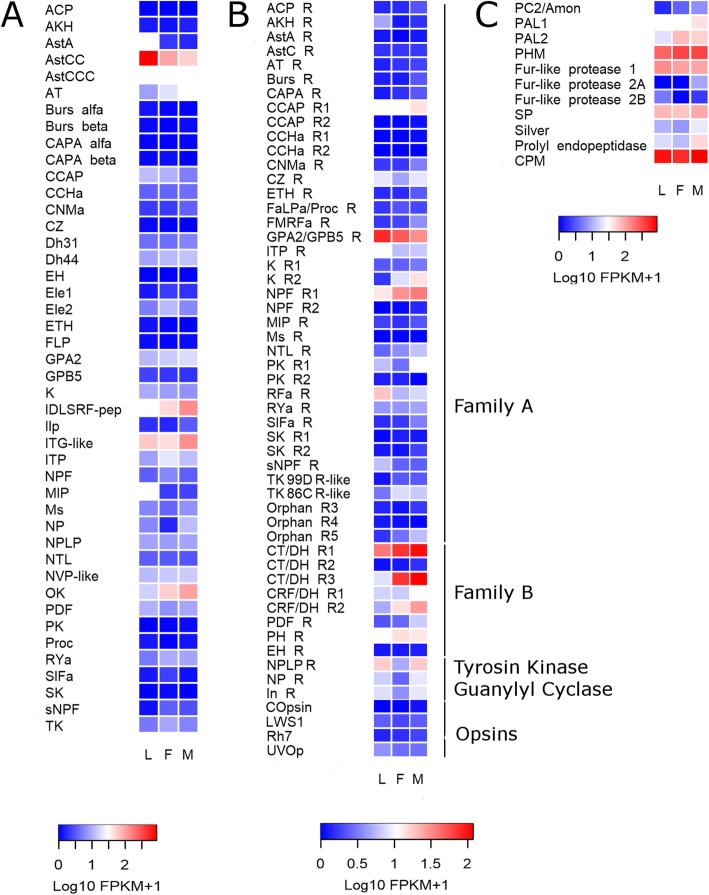
Fig. 1.
Heat map comparing the expression levels of (a) neuropeptide precursor genes, (b) G protein-coupled receptor genes, and (c) neuropeptide processing enzymes in the antennae of R. prolixus larvae (L), female (F) and male (M) adults. Expression levels (displayed as Log10 FPKM + 1) represented by means of a colour scale, in which blue/red represent lowest/highest expression. The complete names of neuropeptide precursor genes, their receptors and enzymes are detailed in Additional files 1, 2 and 5

