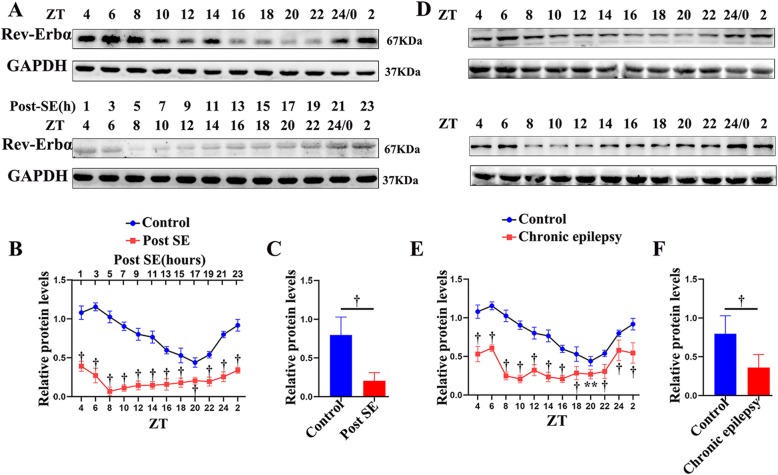
Fig. 3.
Relative protein expression of Rev-Erbα in the hippocampus of mice in the early post-SE (a–c) and chronic phases (d–f). a, d A representative western blot image of Rev-Erbα (67 kDa) and corresponding GAPDH (37 kDa) expression in the hippocampus. Lanes 1–12 represent different time points (ZT 4, 6, 8, 10, 12, 14, 16, 18, 20, 22, 0, and 2). b, e A comparison of the intensity ratio of Rev-Erbα expression between the control and the experimental mice at different time points in the hippocampus in the early post-SE (b) and chronic phases (e). c, f The analysis of the mean protein expression (the mean expression at all ZTs) demonstrated that Rev-Erbα was significantly reduced in both the early post-SE (c) and chronic phases (f). n = 5 for each point. **p < 0.01, †p < 0.001

