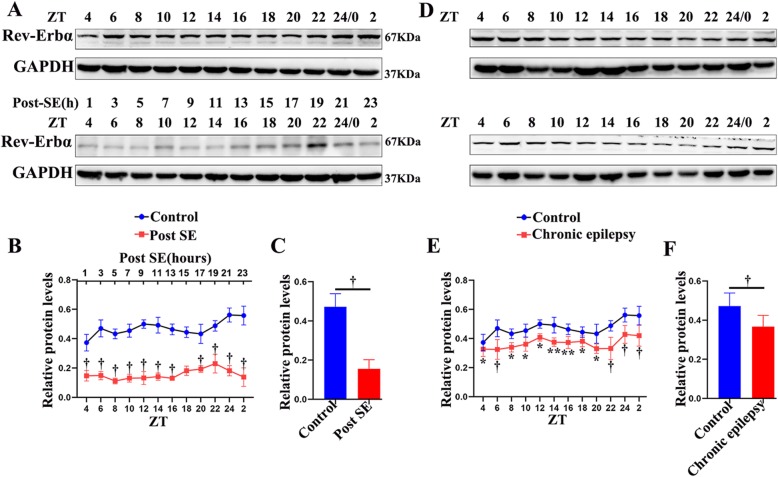
Fig. 4.
Western blotting analysis of Rev-Erbα in the temporal neocortex of mice in the early post-SE (a–c) and chronic phases (d–f). The Rev-Erbα protein was detected as an approximately 67 kDa band. The analysis shows the protein expression of Rev-Erbα in the early post-SE group (b, c) and chronic phase group (e, f) compared to that in the controls throughout the circadian cycle. n = 5 for each point. The data are expressed as the mean ± SD. *p < 0.05, **p < 0.01, †p < 0.001

