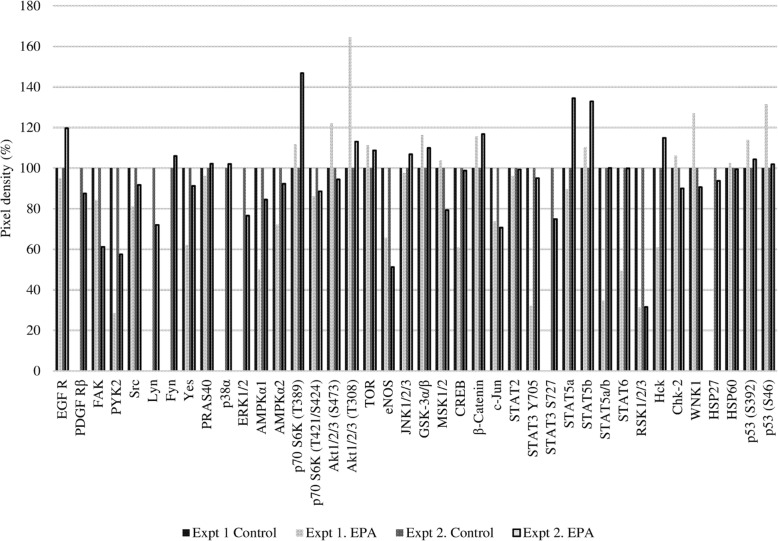
Fig. 5.
Results of two experiments using the human phosphokinase array. The y axis shows pixel density (%). For the control groups in experiments 1 and 2 (Expt1 Control and Expt2 Control, respectively), the expression level of each protein was adjusted to 100%. For the EPA-treated groups in experiments 1 and 2 (Expt1 EPA and Expt2 EPA, respectively), the expression level of each protein was determined relative to that in the corresponding control group

