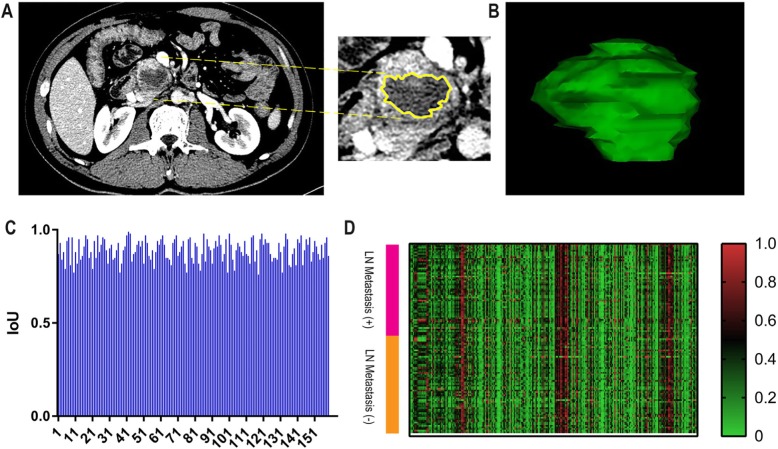
Fig. 2.
Tumor segmentation on CT images with pancreatic ductal adenocarcinoma and heat map. a Segmentation on axial image slice-by-slice (yellow regions). b Three-dimensional view of the tumor. c IoU scores of each patient. d Heat map representation of radiomics features on the x-axis and cases on the y-axis. Right color bar represents color coding of Z-scores of each radiomics feature on 118 cases, in the primary cohort

