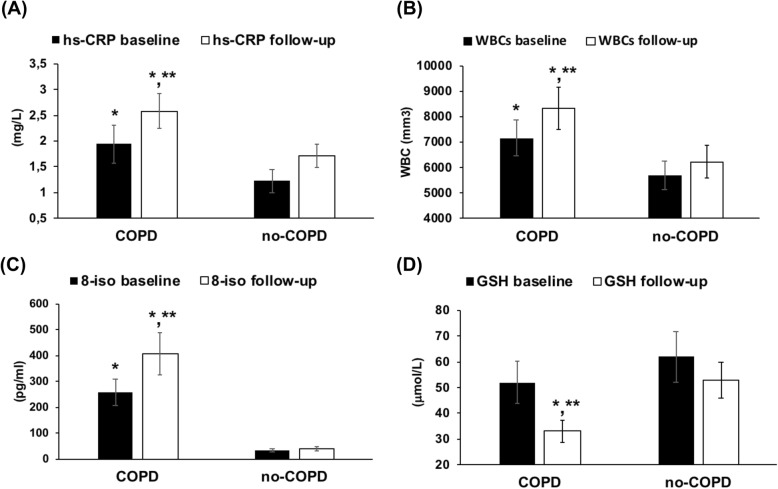
Fig. 3.
Circulating markers of inflammation and oxidative stress in COPD and no-COPD groups at baseline and at follow-up. a High-sensitivity C-reactive protein (CRP) plasma concentrations. b White blood cells (WBCs) count. c 8-isoprostane (8-iso) plasma concentrations. d Glutathione (GSH) plasma concentrations. Data are expressed as mean ± SD. *p < 0.01 vs no-COPD baseline or follow-up. **p < 0.01 vs baseline

