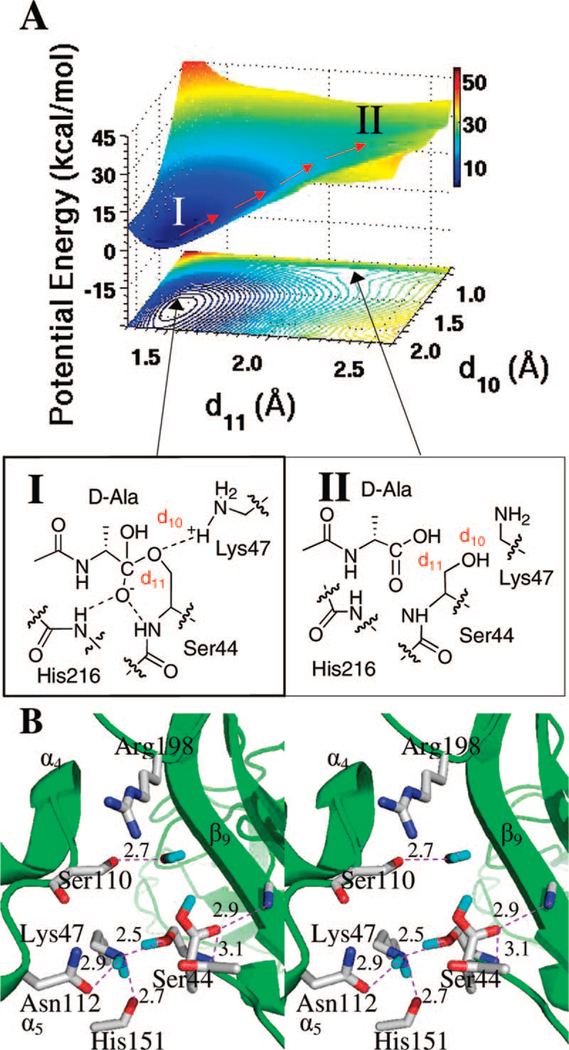
Figure 6.
(A) QM/MM potential-energy surface and the contour over reaction coordinates represented as a shadow. The reaction path is shown by red arrows from the second tetrahedral species (I) to the enzyme–product complex. (B) Stereo representation of the enzyme–product complex (II). Hydrogen bonds are shown as dashed lines (distances in Å between heteroatoms). The complex is nestled between β9 sheet and the loop connecting α4 and α5 helices, with the protein depicted as the ribbon representation in green. Important active site residues and the substrate are represented in capped-stick. Carbon atoms are colored in gray, nitrogen in blue, oxygen in red, and hydrogen in cyan. Distances (Å) are rounded to the nearest tenth.

