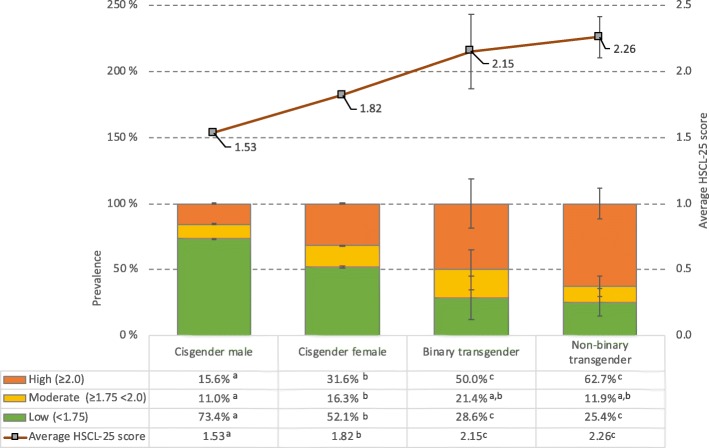
Fig. 3.
Prevalence of mental health problems (in bars) stratified by gender identity. Lines indicate HSCL average scores. Error bars represent 95% confidence intervals. HSCL-25 = Hopkins Symptoms Checklist-25. Significant gender group differences are indicated for each row in the table using subscript letters, calculated at the .05 significance level

