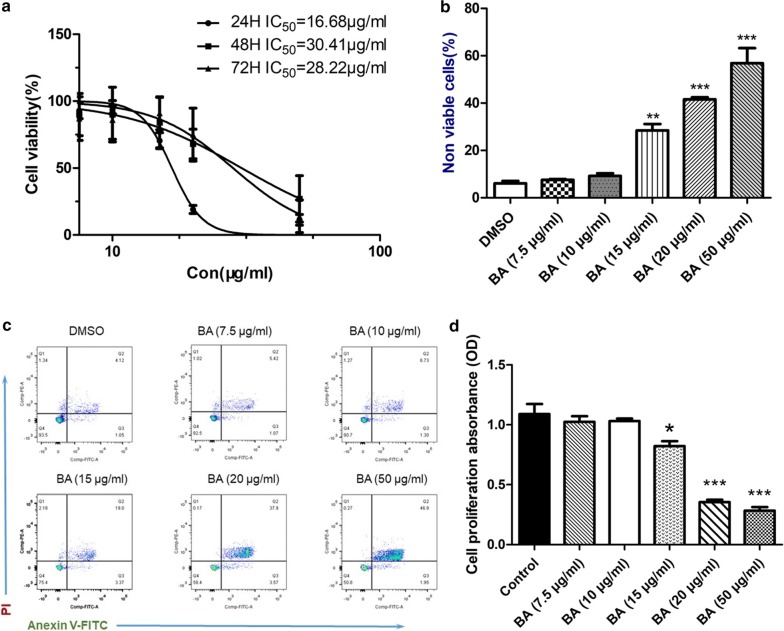
Fig. 2.
The cytotoxicity of baicalin with the CNE-2R cell lines. a The IC50 values of baicalin on the proliferation of CNE-2R cell lines in different drug influence times. b, c The influence of CNE-2R on apoptosis with different concentrations of baicalin. Apoptosis was identified by Annexin V/PI staining. Early apoptotic cells are revealed in the lower right quadrant of the chart, while the upper right quadrant showed late apoptotic cells (Annexin V +/PI +). The data of histogram was presented as the mean ± standard deviation of 3 replicates. d The impact of baicalin on the proliferation of CNE-2R in 24 h. Cell viability was determined by the CCK-8 assay and expressed with O.D. values. Data were presented as mean ± SD. *P < 0.05 and ***P < 0.001 were contrasted with the control group

