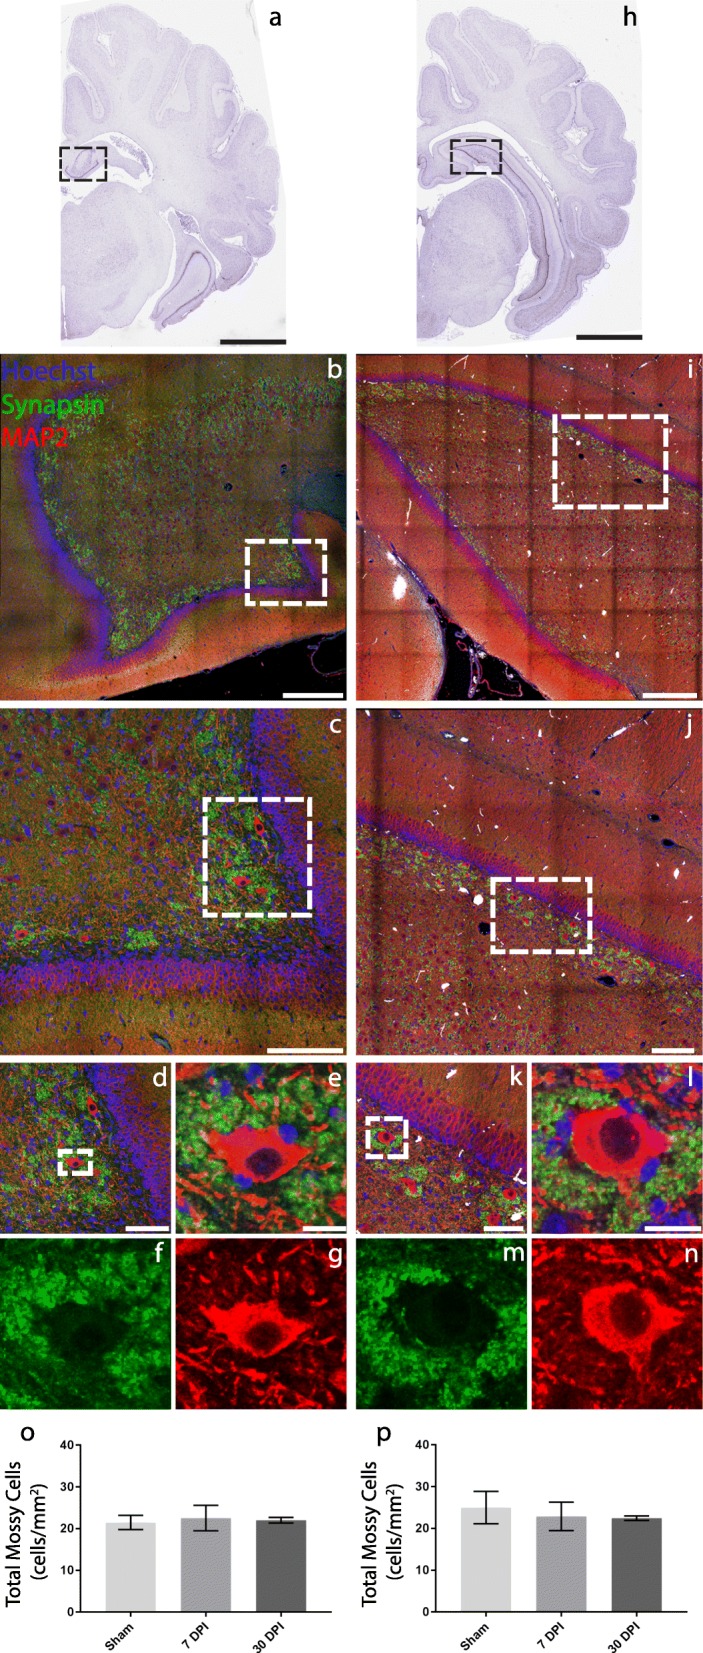
Fig. 2.

Immunohistochemical labeling reveals mossy cell morphology, but no cell loss following mild TBI. Coronal sections of pig brain containing the anterior (a) and posterior (h) levels of hippocampus used for the current analysis (scale = 1 mm). b The call-out box in a is labeled for Hoechst—a fluorescent DNA marker, synapsin—a presynaptic vesicle marker, and MAP2—a microtubule associated protein (scale = 500 μm). c A zoom-in of the call-out box in b (scale = 200 μm). d A zoom-in of the call-out box in c (scale = 100 μm). e–g A single cell view of an anterior hilar mossy cell from the call-out box in d. The overlay of all fluorescent labels is depicted (e), while the individual labels of synapsin (f) and MAP2 (g) are also shown (scale = 20 μm). i The call-out box in h is labeled for Hoechst, synapsin, and MAP2 (scale = 500 μm). j A zoom-in of the call-out box in i (scale = 250 μm). k A zoom-in of the call-out box in j (scale = 100 μm). l–n A single cell view of a posterior hilar mossy cell from the call-out box in k. The overlay of all fluorescent labels is depicted (l), while the individual labels of synapsin (m) and MAP2 (n) are also shown (scale = 20 μm). Bar graphs of the total number of mossy cells in anterior (o) and posterior (p) sections show that there is no frank loss of mossy cells following mild TBI
