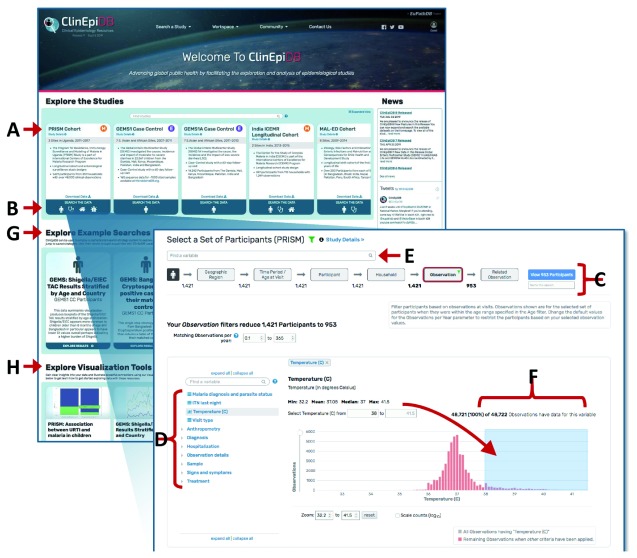
Figure 2. Using the Search Wizard to explore variables.
(A) Clicking a card study name opens a study page. (B) Clicking on a card search icon initiates a search. (C) The Search Wizard categorizes the variables into discrete steps. The grey buttons let users move between steps. (D) The variable tree contains all variables within that step of the Search Wizard. To subset the data, users can open a variable from this tree. (E) The “Find a variable” search bar searches for variables based on variable names and values across all Search Wizard steps. (F) Continuous data are displayed as a histogram and can be constrained by typing the exact range of values or clicking and dragging the mouse across the range of interest. (G) Clicking cards underneath “Explore Example Searches” opens up examples of searches conducted using the datasets indicated. These searches can be edited. (H) Clicking cards underneath “Explore Visualization Tools” opens up examples of how the exploration applications can be used.

