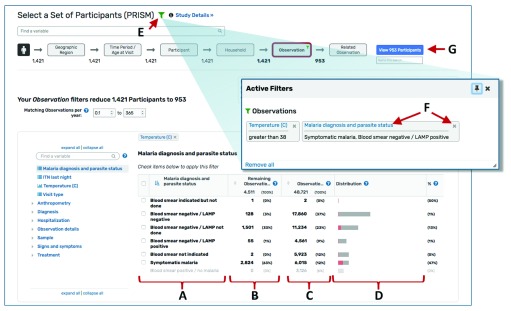
Figure 3. Adding, editing, and removing filters.
Categorical data are displayed in a table and (A) can be selected via check boxes next to the values. (B) The “Remaining” column indicates the data remaining given all other data selections (including selections in upstream steps), while the (C) Observations column indicates the total counts for all data. (D) For both continuous and categorical variables, data that meet the filter criteria (“remain”) are shown in red on the distribution graph while data that do not meet the filter criteria are shown in grey. (E) Clicking the green filter icon brings up a box that lists all applied filters. (F) Users can click the blue link to edit a filter or the “x” to remove it. (G) The blue button takes the user to the results page.

