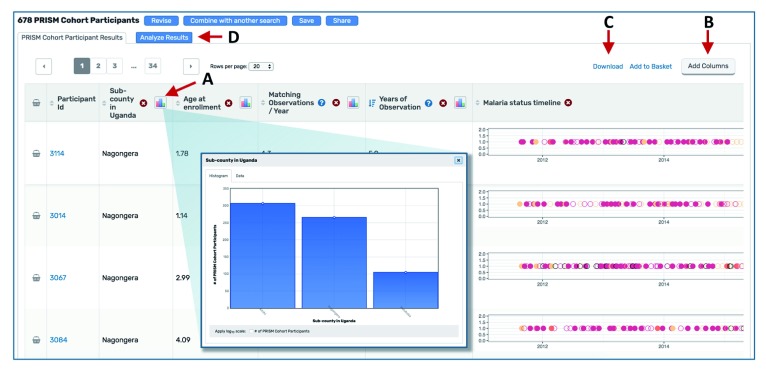
Figure 4. Using the Results Page.
(A) Clicking a histogram icon opens a pop up showing the distribution of data for that variable. (B) The “Add columns” button allows users to change which variables are shown in the table. (C) The “Download” link directs users to a page where they can choose which variables to download. The data subset is based on the selections applied in the Search Wizard. (D) The “Analyze Results” tab leads to a suite of applications for further data visualization.

