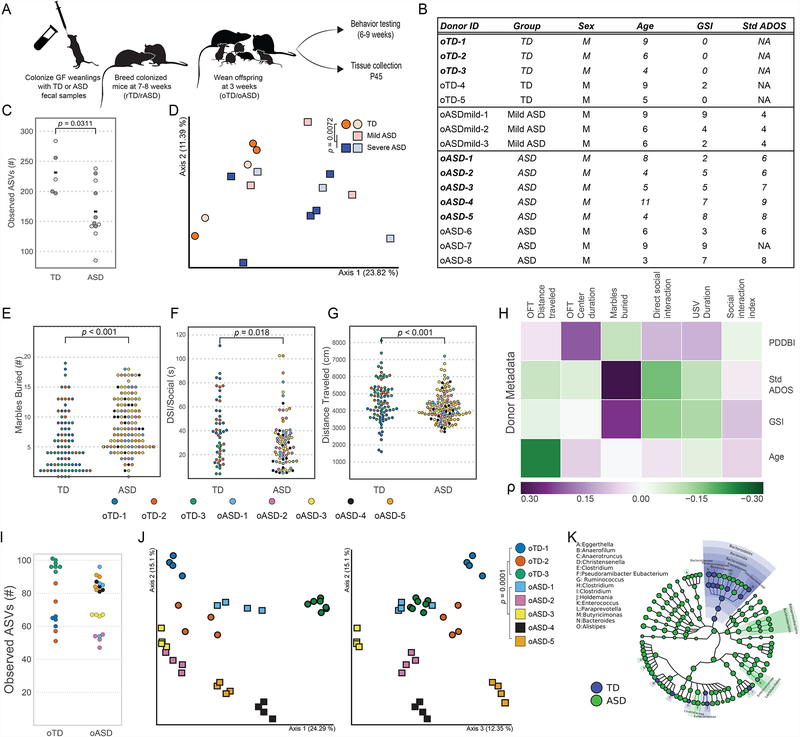
Figure 1. Colonization of mice with ASD microbiomes reproduces human behaviors.
(A) Experimental design: germ-free mice were colonized with fecal samples from TD or ASD donors at weaning and bred at 7–8 weeks of age. Offspring were behaviorally tested starting at 6 weeks of age, and various tissues and samples were collected at P45.
(B) Donor metadata. Metadata for sixteen donors used for mouse colonization, of which eight were followed up on with downstream analysis (in bold). See Table S1.
(C) α-diversity in human TD (circles) and ASD (mild ASD-blue squares, ASD-red squares) donors as measured by observed amplicon sequence variants (ASVs) from 16S rRNA gene sequencing of human TD and ASD donors. Eight samples used downstream are in dark-grey. Differences in medians tested by Kruskal-Wallis.
(D) First two axes of a principal coordinate analysis (PCoA) of unweighted UniFrac distances from 16S rRNA gene sequencing of human TD and ASD donors. NTD=5, Nmild ASD=3, NASD=8. Darker symbols denote samples in bold in Figure 1B. Group differences were tested by pairwise PERMANOVA.
(E-G) Behavioral phenotypes in humanized mice: (E) Number of marbles buried in Marble burying (MB) test (Cohen’s doTD-oASD= 0.64), (F) time socializing in direct social interaction (DSI)(Cohen’s doTD-oASD= −0.45), and (G) distance traveled in open field testing (OFT)(Cohen’s doTD-oASD= −0.58); in colonized offspring colored by donor. Hypothesis testing for differences of the means were done by a mixed effects analysis using donor diagnosis and mouse sex as fixed effects and donor ID as a random effect. p-values were derived from a chi-square test. NoASD= 121, NoTD= 85 (8–23 mice per donor, per gender). Data presented is the aggregate of all experiments.
(H) Spearman’s rank correlation between mouse behavior and donor metadata (see Table S1). Benjamini-Hochberg adjusted p-values for significant (α≤0.05) correlations are noted. Color scale denotes Spearman’s ρ from purple (positive correlation) to green (negative correlation). GSI: Gastrointestinal Severity Index; StdADOS: standardized Autism Diagnostic Observation Schedule score; PDDBI: Pervasive Developmental Disorder Behavior Inventory.
(I) α-diversity in humanized oTD and oASD mice as measured by observed amplicon sequence variants (ASVs) from 16S rRNA gene sequencing of human TD and ASD donors. Differences in medians tested by Kruskal-Wallis. Data are colored by donor. N=4–7 male offspring per donor.
(J) First three axes of a PCoA of unweighted UniFrac distances from oTD (circles) and oASD (squares) male offspring mice (colored by donor) from 16S rRNA gene sequencing of human TD and ASD donors. Group differences were tested by pairwise PERMANOVA. N=4–7 male offspring per donor.
(K) GraPhLan plot of LefSe linear discriminant analysis of microbiome profiles up to the genus level from 16S rRNA gene sequencing of human TD and ASD donors. Highlights denote significant taxonomic differences between oTD and oASD mice. N=4–7 male offspring per donor.
See also Figures S1–S3, Table S1.

