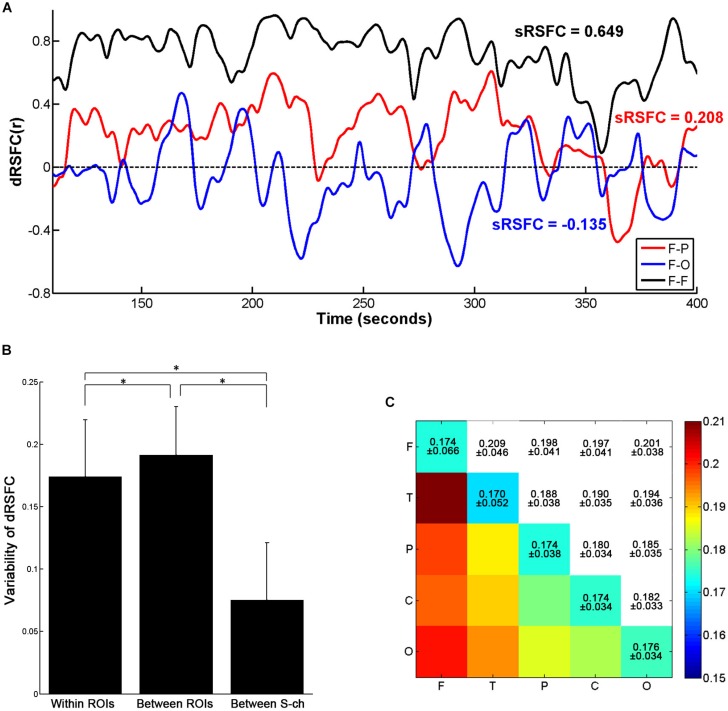
FIGURE 4.
Variability of the dRSFCs. (A) Examples of dRSFC fluctuations for a representative subject (subject 1). The black line indicates the dRSFC between the bilateral frontal ROIs; the red line indicates the dRSFC between the frontal and the parietal ROIs; and the blue line indicates the connectivity between the frontal and the occipital ROIs. F, frontal area; P, parietal area; T, temporal area; O, occipital area. (B) Group comparison of variability of the dRSFC within and between ROIs and between channels with a short interoptode distance (S-ch). Error bars indicate standard deviations. Asterisks represent significant group differences with a t-test at p < 0.001 (Bonferroni corrected). (C) The means and standard deviations of the dRSFC variability between different ROIs at the group level.

