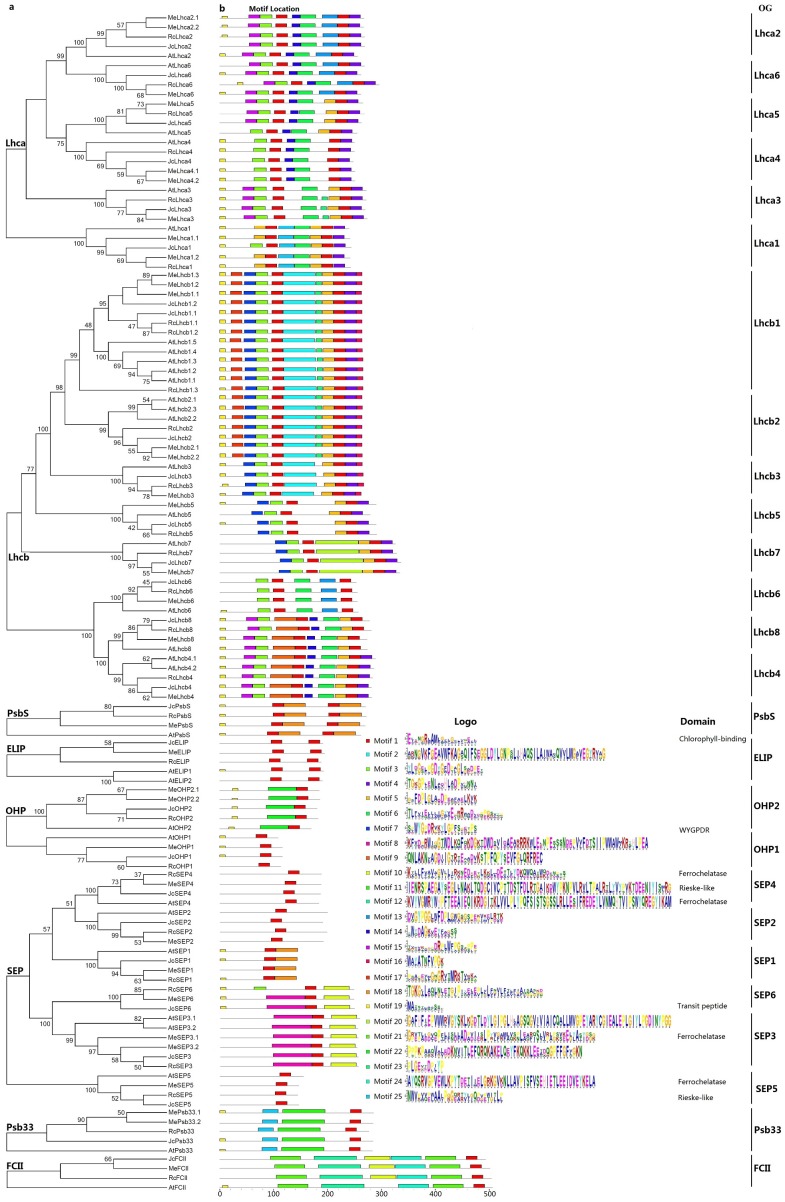
Figure 3. Phylogenetic and conserved motif analyses of jatropha, castor, cassava, and arabidopsis Lhc superfamily proteins.
(A) Phylogenetic analysis of Lhca, Lhcb, PsbS, ELIP, OHP, SEP, Psb33, and FCII subfamilies; (B) Distribution of conserved motifs. Sequence alignment was performed using MUSCLE and unrooted phylogenetic trees were constructed using MEGA7 (maximum likelihood method; bootstrap, 1,000 replicates). Only bootstrap values at nodes supported by a posterior probability of ≥50% are given. The distance scale denotes the number of amino acid substitutions per site. The name of each OG is indicated next to the corresponding group. OG: orthologous group.

