. 2019 Sep 30;45(3):272–277. doi: 10.12865/CHSJ.45.03.04
Copyright © 2019, Medical University Publishing House Craiova
This is an open-access article distributed under the terms of a Creative Commons Attribution-NonCommercial-ShareAlike 4.0 International Public License, which permits unrestricted use, adaptation, distribution and reproduction in any medium, non-commercially, provided the new creations are licensed under identical terms as the original work and the original work is properly cited.
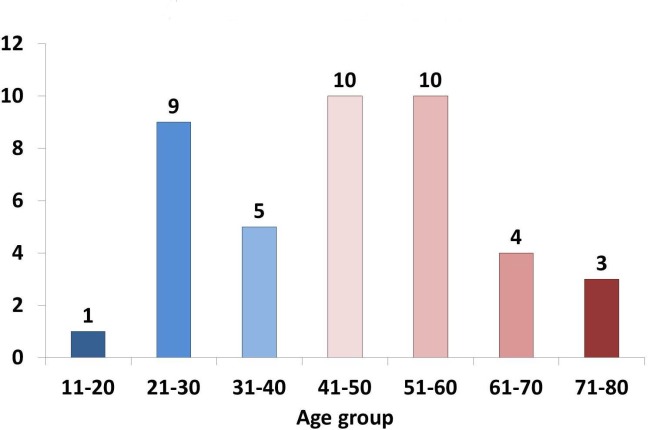
Figure 1.

Age distribution of patients in 10-year groups
