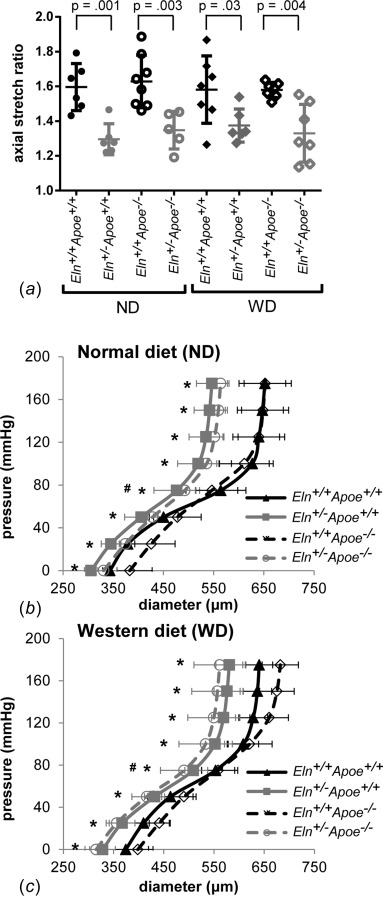
Fig. 1.

In vivo axial stretch ratios (a) were measured by imaging the carotid artery before and after dissection. Individual measurements are shown with mean±SD. P values are from one-way ANOVA for Eln genotype. Mean carotid artery pressure-diameter curves from in vitro mechanical tests are shown for mice on ND (b) or WD (c) for 12 weeks after weaning. Significant effect of *Eln genotype or #Apoe genotype by three-way ANOVA.
