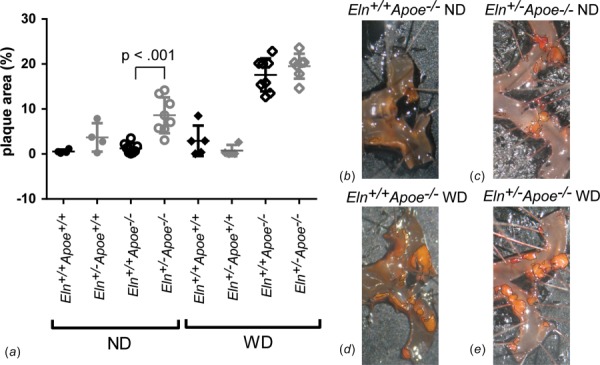
Fig. 7.

Quantification of the percentage of the ascending aorta lumen area covered in plaque (a). P value is from one-way ANOVA for Eln genotype. Results for three-way ANOVA are given in the text. Individual measurements are shown with mean±SD. Representative images of Apoe−/− ascending aorta en face preparations stained with oil red O are shown in panels (b)–(e).
