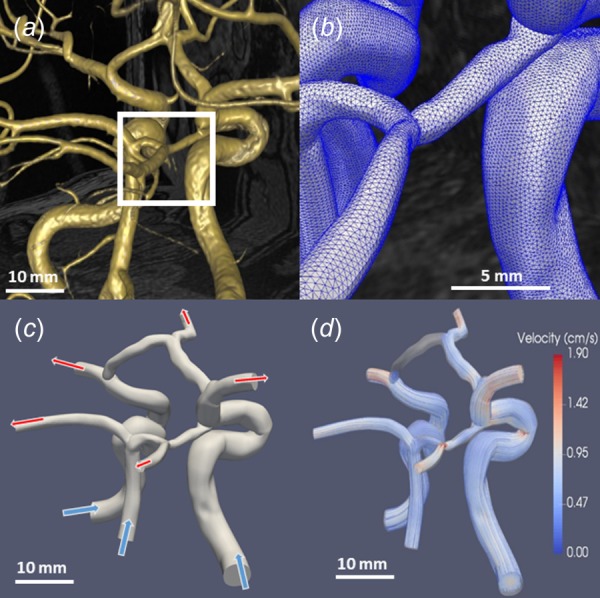
Fig. 1.

Basic progression highlighting the steps from MRI visualization to CFD simulation results. (a) Vessel rendering by simvascular allows for simple and fast visualization [10]. (b) Acloser view of the mesh reveals the individual elements. (c) Arrows (top) represent the outflow of blood while arrows (bottom) show inflow. The inflow of blood was prescribed by volume flow rate waveforms, while outflows are often determined by scaled cross section mass flow, resistor–capacitor–resistor models, or simplified resistor-only boundary conditions. (d) Velocity streamlines used to visualize the results of CFD simulations (unpublished data).
