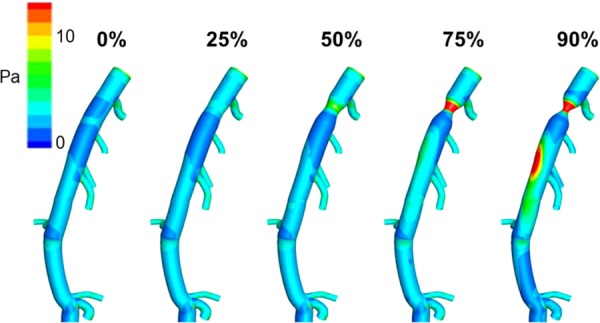
Fig. 5.

Time-averaged wall shear stress distributions at varying levels of proximal stenosis on a porcine LAD model. Points of maximal WSS (black arrows) shift from the ostium of branching vessels to the point of stricture when the stenosis reaches 75%. At 90% stenosis, regions of maximal WSS are also observed distal to the stricture along the outer curvature of the LAD [71]. (Reprinted with permission from Elsevier copyright 2014).
