. 2019 Oct 2;10(46):10765–10771. doi: 10.1039/c9sc03917a

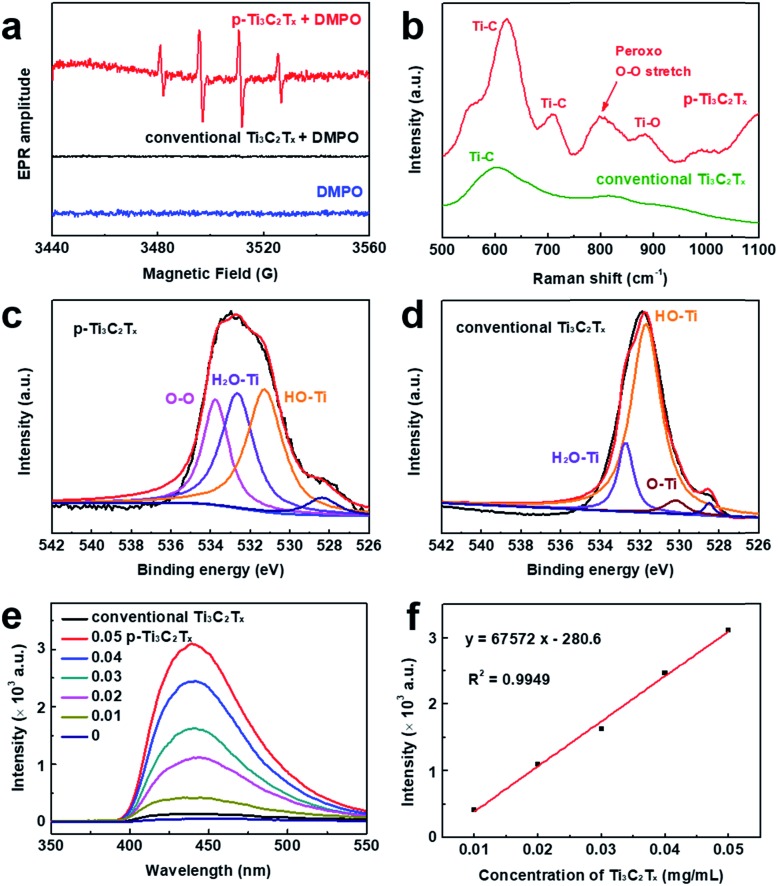
Fig. 3. (a) EPR spectra of p-Ti3C2Tx and conventional Ti3C2Tx obtained by DMPO trapping for ˙OH characterization. (b) Raman spectra of p-Ti3C2Tx and conventional Ti3C2Tx. (c) High-resolution XPS spectra of p-Ti3C2Tx nanosheets prepared by the sonication-assisted MILD etching method in the O 1s region. (d) High-resolution XPS spectra in the O 1s region of Ti3C2Tx nanosheets prepared by the conventional method. (e) Fluorescence spectra of luminol (0.025 M) upon addition of different concentrations of p-Ti3C2Tx nanosheets. The final concentration of p-Ti3C2Tx was from 0.01 to 0.05 mg mL–1; λex = 290 nm. (f) Calibration curve of the luminol assay for p-Ti3C2Tx.

Fig. 3