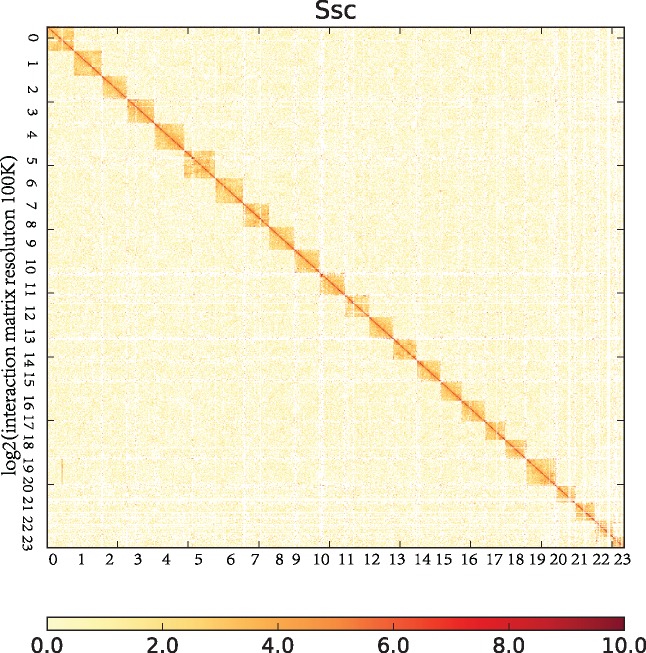
Figure 2.
The contig contact matrix from the genome of Sebastes schlegelii derived from Hi-C data. In the plot, the red colour indicates a high-density logarithm and the white colour indicates a low contact density logarithm. In Hi-C analysis, the genome was divided into bin by 100k. The number of interactions between bin reads was calculated, that is, the number of interactions between bins. Each point in the figure represents the number of interactions between bins with horizontal and vertical coordinates, and the colour intensity represents the strength of the interactions. Genome-wide interactions tend to be more intra-chromosomal than inter-chromosomal.

