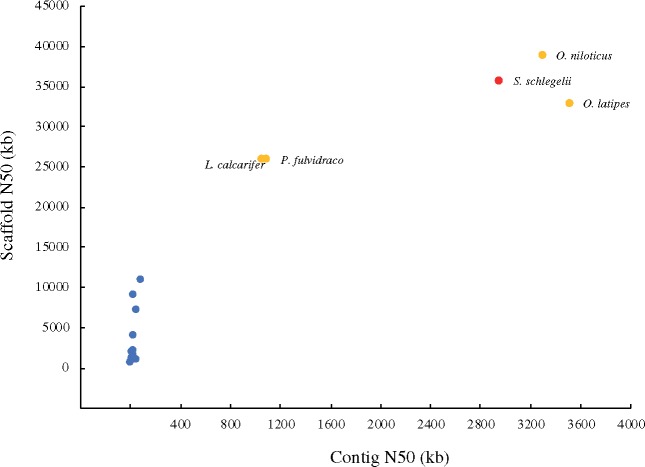
Figure 4.
Comparison of the Sebastes schlegelii genome with other publicly available teleost genomes. The x axis represents the contig N50 values and the y axis represents the scaffold N50 values. The genomes sequenced with PacBio are highlighted in orange and the genome of S. schlegelii is highlighted in red.

