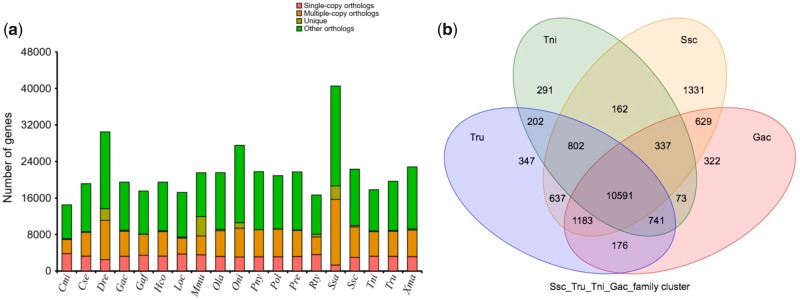
Figure 6.
Gene-family cluster analysis. (a) The comparison of gene families from Sebastes. schlegelii and other teleosts. The horizontal axis indicates the species and the vertical axis represents the number of genes. The pink colour represents single-copy genes; yellow represents multiple-copy genes; deep yellow represents unique paralogues; green represents other orthologues and unclustered genes. Here, other means except the above three types. Some genes were not clustered in the gene family or clustered in a gene family from some of the species. (b) The gene-family Venn diagram. Ssc, Sebastes schlegelii; Gac, Gasterosteus aculeatus; Tru, Takifugu rubripes; Tni, Tetraodon nigroviridis.

