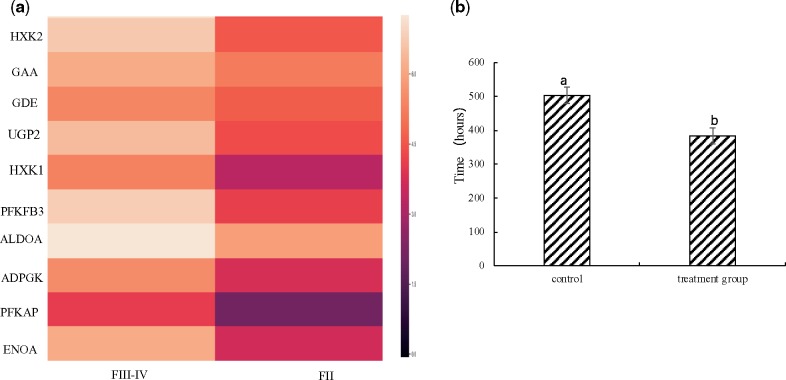
Figure 8.
The interaction of ovary microenvironment and sperm storage. (a) The heatmap of carbohydrate metabolism-related gene expression from Pre-copulation (FII) to post-copulation (FIII–IV); the higher the gene expression, the lighter the colour. The quantities expression was calculated based on FPKM (expected number of Fragments Per Kilobase of transcript sequence per Millions base pairs sequenced); (b) the time of sperm survivability of control and experimental groups (sodium iodoacetate treatment) in vitro. The error bars were calculated by mean value ± standard deviation, and are shown as standard deviation.

