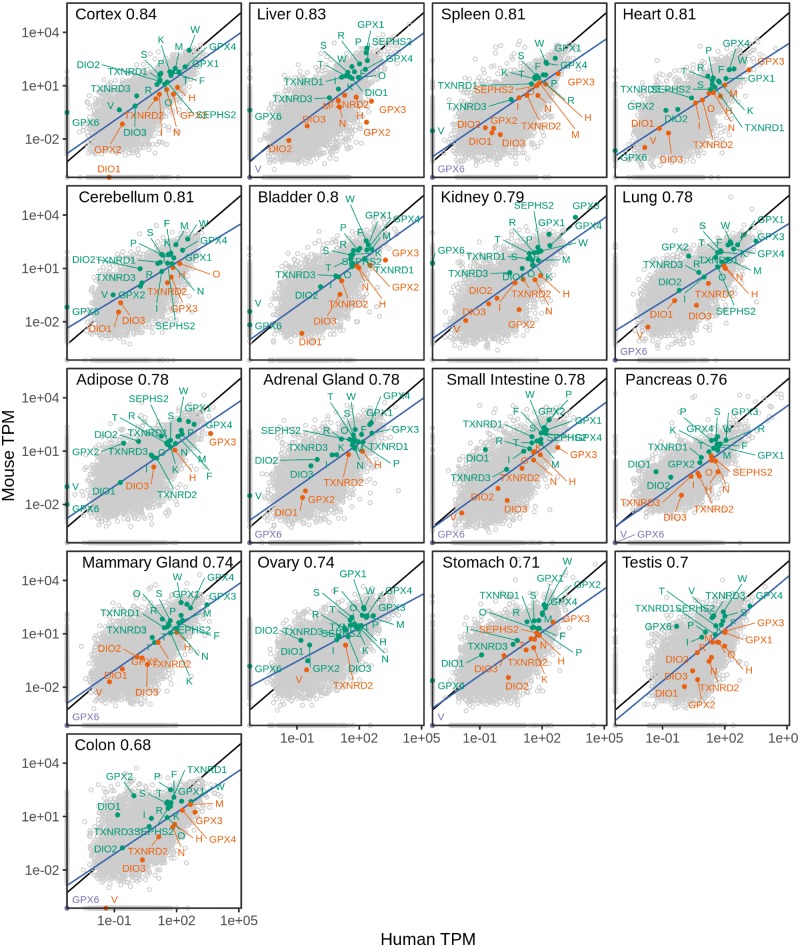
Fig. 4.
Correlation of selenoprotein gene expression between human and mouse across tissues. Each panel shows the tissue and the corresponding Spearman’s correlation coefficient (P value <1e-16 in all tissues). The blue line corresponds to the fitted linear model using 15,610 one-to-one orthologs (gray dots). Selenoproteins are labeled and colored based on the sign of the residuals, which indicates whether they are above or below the regression line. The prefix “SELENO” was removed from gene names, for example, V corresponds to SELENOV. Expression values in log scaled TPM (transcripts per million reads). RNA-seq quantification obtained from GTEx v7 (human) and ENCODE (mouse).

