
Figure 2.
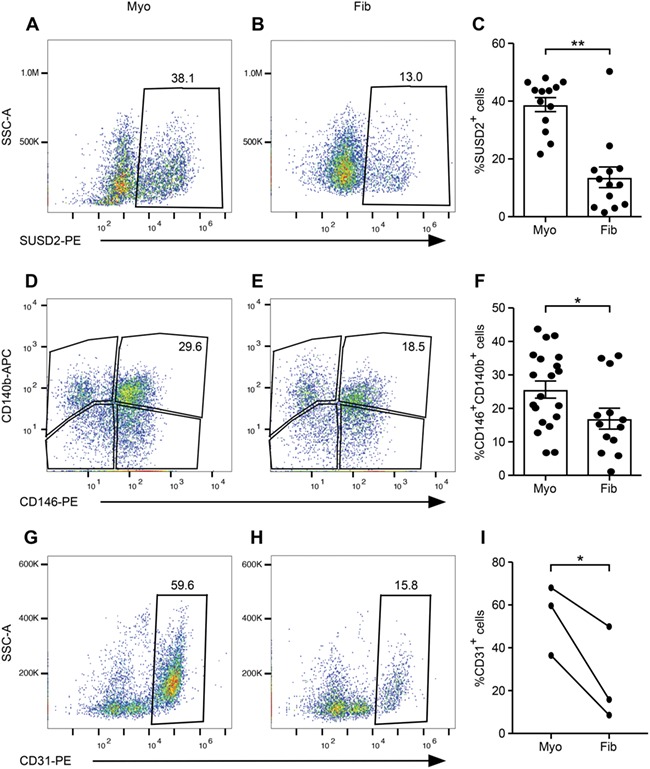
Flow cytometry characterisation of myometria and fibroids. Representative flow cytometry scatter plots of SUSD2 (A, B), CD146/CD140b− (D, E) and CD31− (G, H) expressing cells are shown in myometrial (A, D, G) and fibroid (B, E, H) tissues. Graphs show the percentages of SUSD2+ [(C), n = 13, Wilcoxon matched-pairs signed-rank test, P = 0.004], CD146+CD140b+ [(F), n = 20 myometria, n = 13 fibroids, unpaired t test with equal SD, P = 0.04], and CD31+ [(I) (n = 3, paired t test with equal SD, P = 0.05] cells in myometrial and fibroid samples. Error bars are ± SEM. SSC-A, side scatter area, PE, phycoerythrin, APC, allophycocyanin.