
FIGURE 3.
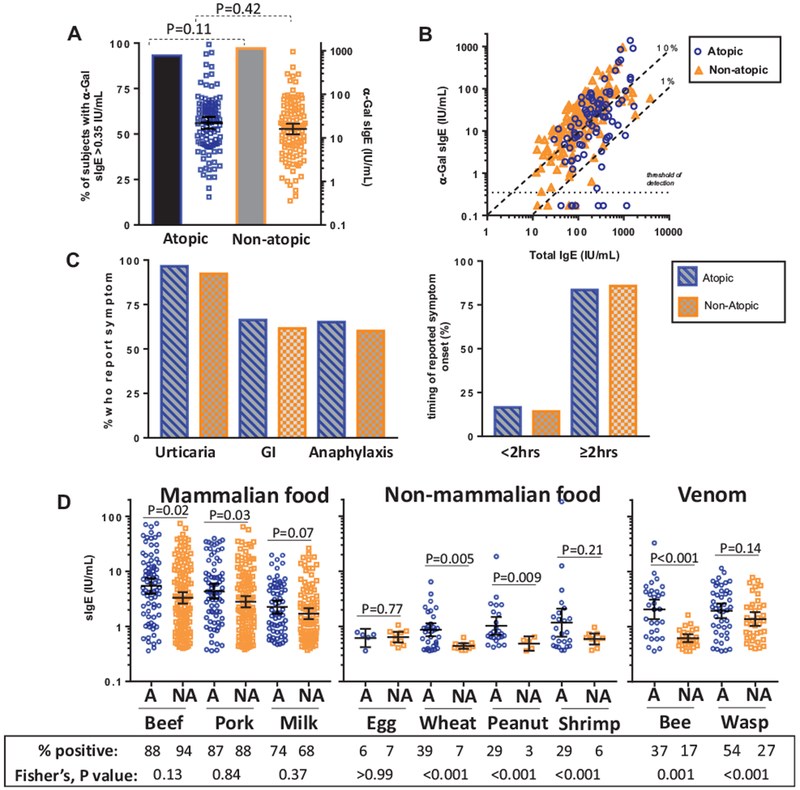
Relationship between characteristics of galactose-α-1,3-galactose (α-Gal) syndrome and atopy among subjects reporting reactions to red meat. A, Prevalence (bar graph, left y-axis) and titers (scatter plot, right y-axis) of specific IgE (sIgE) to α-Gal in atopics and nonatopics (where atopy defined as sIgE ≥ 0.7 IU/mL to dust mite, Timothy grass, and/or ragweed). B, Correlation of α-Gal sIgE and total IgE in atopic (n = 83) and nonatopic subjects (n = 143) who reported allergic reactions to mammalian meat. C, Symptoms reported by red meat allergic subjects in relation to atopy status. D, Prevalence (shown in table format under the graph) and titers of sIgE to mammalian and nonmammalian foods, and venom, among atopic and nonatopic subjects reporting reactions to red meat where A denotes atopic and NA denotes nonatopic. Data expressed as geometric mean with 95% confidence interval; levels of detected sIgE compared by the Mann-Whitney U test and prevalence compared by Fisher’s exact test. GI, Gastrointestinal.