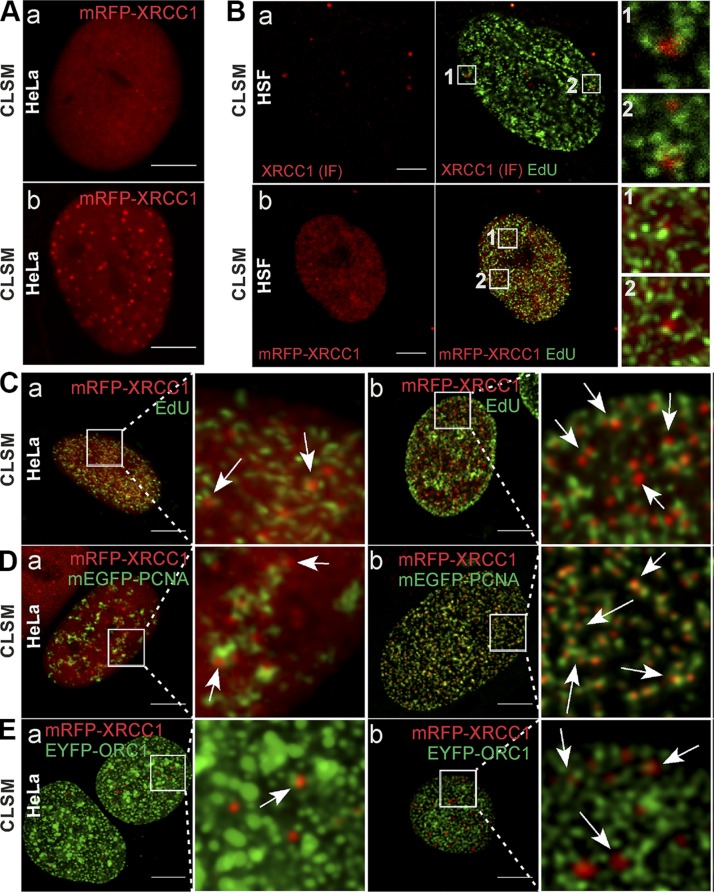
Figure 1 .
Association between XRCC1 foci and replication sites in HeLa and HSF cells. A) Examples of HeLa nuclei containing very few (a) or large numbers of XRCC1 foci (mRFP-XRCC1, red) (b) in live cells. B) XRCC1 foci detected by IF (a, red) or imaging of mRFP-XRCC1 (b, red), and replication sites (EdU, green) demonstrating their close spatial association (enlarged fragments of images) in nuclei of normal HSFs. C) XRCC1 foci [low (a) or high (b) number] and neighboring replication sites (arrows) in cells expressing mRFP-XRCC1; regions of active DNA replication visualized via EdU (green). D) XRCC1 foci [low (a) or high (b) number] and neighboring replication sites (arrows) in cells expressing mRFP-XRCC1; replication regions visualized via mEGFP-PCNA (green). E) XRCC1 foci [low (a) or high (b) number] and neighboring replication sites (arrows) in cells expressing mRFP-XRCC1; regions of early replication visualized via EYFP-ORC1 (green; note that EYFP fluorescent signal is represented by green color instead of yellow in all images in order to avoid confusion with colocalization analyses, where overlap of green and red is represented by yellow color). Microscopy images were acquired using confocal laser scanning microscopy. Scale bars, 5 μm; ROI, 5 × 5 μm.

