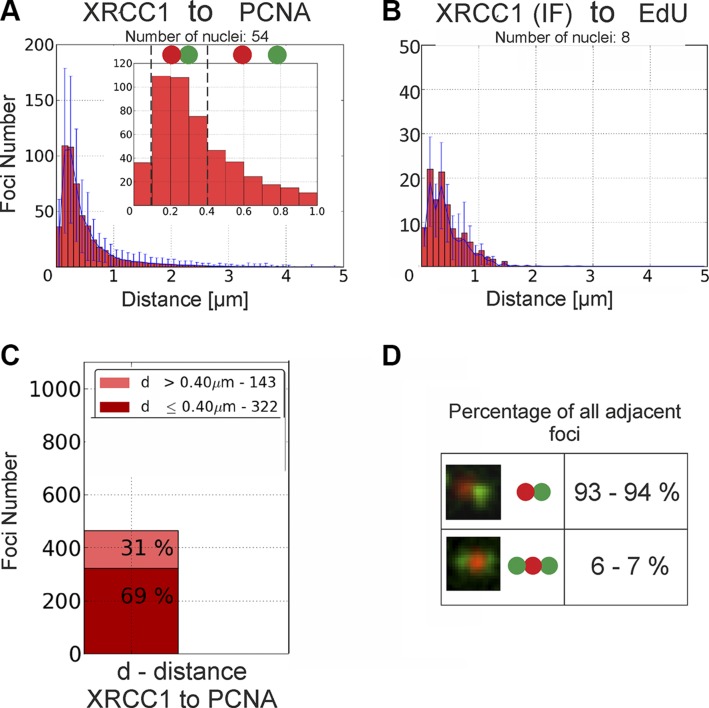
Figure 2 .
Quantitative analyses of spatial positions of XRCC1 foci relative to replication sites in cells exhibiting high number of XRCC1 foci [live (A), IF (B)], showing their close association but little overlap. A) Histogram of distances measured from barycenters of mRFP-XRCC1 repair foci to barycenters of nearest replication sites (mEGFP-PCNA). Inset shows enlarged fragment of histogram and presents results obtained for range of distances between 0 and 1 µm. Low number of cases where distance between neighboring foci is smaller than 100 nm suggests occurrence of nearly no or very little overlap between XRCC1 foci and replication sites; see also analysis of all substages of S phase in Supplemental Fig. S3A. B) Histogram of distances measured from barycenters of immunofluorescently labeled XRCC1 foci (IF) to replication foci (EdU). C) Percentage of XRCC1 foci located close to or far from of nearest replication site. D) Percentage of all XRCC1 foci (analyzed in A and B) classified as adjacent to replication regions that have either only one or two neighboring replication regions in close vicinity.

