Figure 3 .
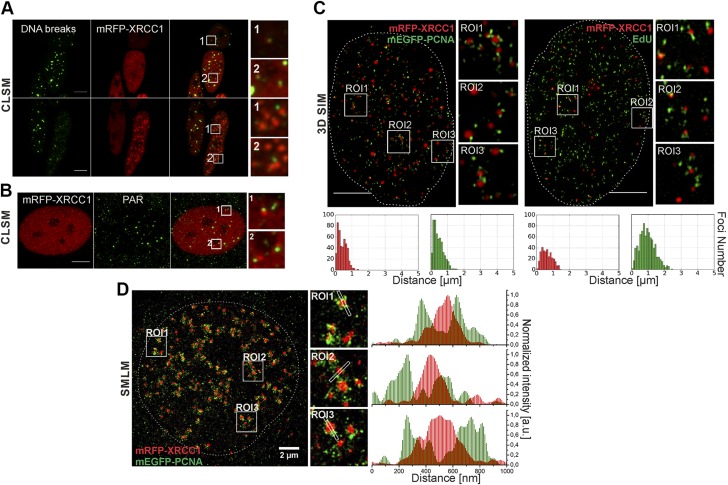
Direct detection of free DNA ends (DNA breaks), XRCC1 foci, and replication sites, and superresolution imaging of positions of XRCC1 foci and replication sites. A) Localization of DNA breaks (improved TUNEL assay, green) outside or within periphery of XRCC1 foci (mRFP-XRCC1, red). B) Localization of PAR chains (IF, green) detected always outside or within periphery of XRCC1 foci (mRFP-XRCC1, red). C) XRCC1 (mRFP-XRCC1, red) and replication (mEGFP-PCNA or EdU) in superresolution images (3D SIM). XRCC1 regions appear as tightly packed foci or nuclear bodies. Images and histograms of distances between barycenters of XRCC1 foci and small replication regions in these images confirm spatial association between XRCC1 foci and sites of active replication. Only some sites of active replication develop SSB and have adjacent XRCC1 focus (Supplemental Fig. S3B). Two maxima in these histograms indicate that there are two subpopulations of XRCC1 foci and two subpopulations of replication foci. XRCC1 foci of one subpopulation are located very close to sites of active replication (presumably groups of replication forks). Foci of other group have no adjacent replication region; these foci most likely represent stress bodies formed afar of sites of DNA damage (5). Only some sites of active replication develop SSB and have adjacent XRCC1 focus. Supplemental Figure 3B shows more examples of histograms corresponding to other 3D SIM superresolution images of XRCC1 foci and replication sites. D) Superresolution single-molecule localization image shows nucleus expressing mRFP-XRCC1 and mEGFP-PCNA. Replication sites consist of numerous small objects, while XRCC1 foci appear as larger solid structures. XRCC1 foci are adjacent to but do not overlap regions of replicating DNA (fluorescence profiles). Scale bars, 5 μm. ROI: 3.5 × 3.5 μm (A); 3.2 × 3.2 μm (B); 2.7 × 2.7 μm (C, D).

