Figure 4 .
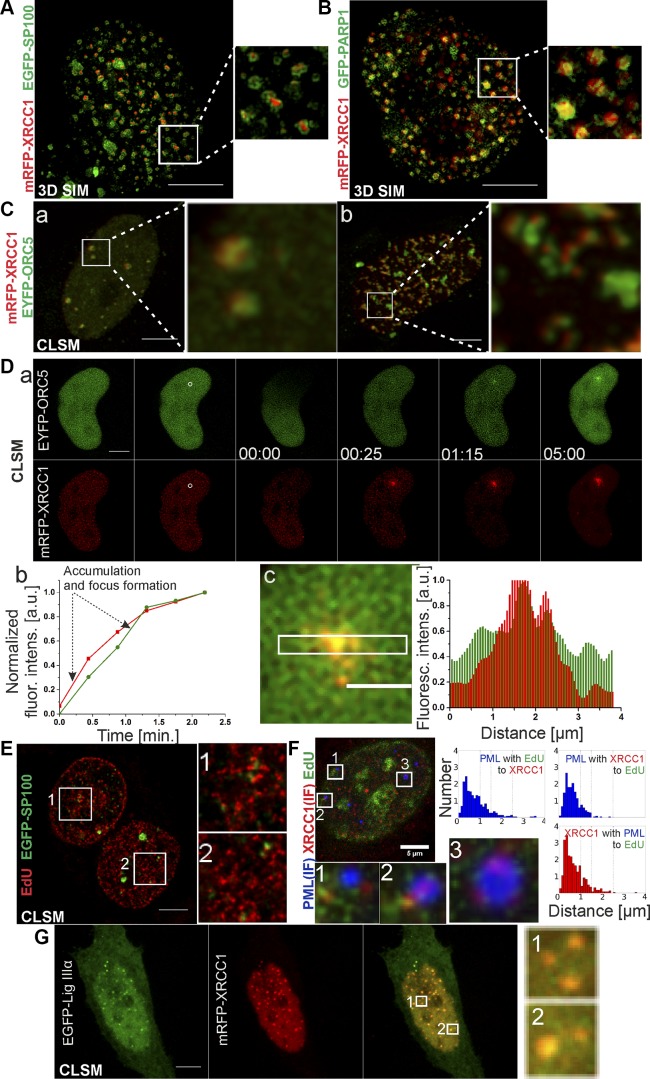
Components and architecture of nuclear foci formed by XRCC1, imaged by 3D SIM and fluorescence confocal microscopy. A) XRCC1 (mRFP-XRCC1, red) foci contain SP100 (EGFP-SP100, green). XRCC1 foci are tightly associated with SP100. 3D SIM images (equatorial slice, maximum projection) show that SP100 forms shells of spherical nuclear bodies, wrapped around subcompartments containing XRCC1. B) XRCC1 (mRFP-XRCC1, red) foci contain PARP1 (GFP-PARP1, green). PARP1 foci are generally smaller than foci of XRCC1. Their diameter ranges between 100 and 400 nm. 3D SIM images show that usually few small PARP1 foci are closely adjacent to single XRCC1 focus most likely belonging to same nuclear structure. C) Confocal imaging demonstrates that XRCC1 (mRFP-XRCC1, red) foci colocalize (a) or are adjacent to (b) ORC5 (EYFP-ORC5, green) foci, marking early replication origins. D) ORC5 (EYFP-ORC5, green) is recruited to local DNA damage ∼30 s after XRCC1 (red) which is presented in the sequential confocal images (a). Accumulation of these 2 proteins in time is illustrated (b). Mean fluorescence intensity values measured in the area of accumulation of the proteins were normalized to the values of the mean fluorescence intensity measured in the undamaged area of the nucleus. The accumulation of proteins and foci formation are represented by the increased steepness of the curves. Fluorescence intensity profiles additionally confirm accumulation of the proteins in the same area (c), colocalization of XRCC1 and ORC5 foci is represented by an overlap of the green and red fluorescent signals which results in the yellow color in the enlarged part of the merged image (c). E) SP100 (EGFP-SP100) foci (green) are closely adjacent to replication sites (EdU, red), similar to previously described XRCC1 foci. F) Often XRCC1 (mRFP-XRCC1, red) is found within PML bodies (IF, blue). Histograms of distances between centers of foci containing both PML and XRCC1 to replication foci (EdU, green) demonstrate that when PML body is located in close vicinity of replication region, it always comprises XRCC1 component. G) Confocal imaging shows that nuclear bodies rich in mRFP-XRCC1 (red) colocalize with EGFP-Lig IIIα foci (green); overlapping green and red fluorescent signals result in conspicuous yellow color, clearly visible in enlarged areas of merged image, thus confirming presence of Lig IIIα in XRCC1-containing PML nuclear bodies. Scale bars, 5 μm (A–C, Da, E–G), 2 μm (Dc); ROI: 3.4 × 3.4 μm (A, B); 3.6 × 3.6 μm (Ca); 4.25 × 4.25 μm (Cb); 5.3 × 5.3 μm (E); 2.1 × 2.1 μm (F); 2.5 × 2.5 μm (G).

