Figure 2.
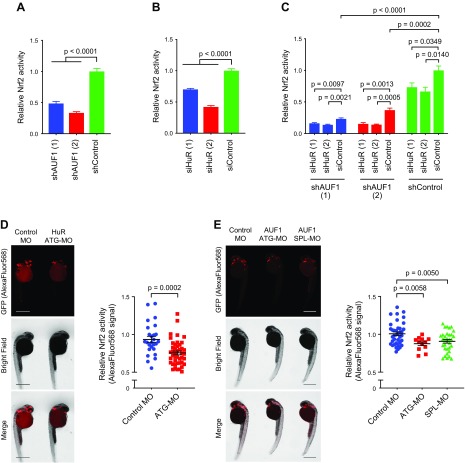
Depletion of HuR or AUF1 in cells and larval zebrafish suppresses Nrf2 activity. A, B) Nrf2 activity in HEK293T cells depleted of AUF1 and HuR, respectively [mean ± sem of n = 12 (AUF1) and n = 8 (HuR) independent replicates per condition]. See also Supplemental Fig. S1B, C. C) Nrf2 activity upon simultaneous knockdown of HuR and AUF1 (mean ± sem of n = 4 independent replicates). See also Supplemental Fig. S7A. D, E) Nrf2 activity in Tg(gstp1:GFP) zebrafish upon knockdown of zHur and zAuf1. Larvae are stained with a red fluorescent antibody because green background fluorescence at this developmental stage prevents accurate quantitation of the GFP reporter signal. Inset: quantitation (mean ± sem) of mean fluorescence intensity measured using the Measure tool of ImageJ [sample sizes analyzed: D: n = 26 (Control MO), 44 (ATG-MO); E: n = 38 (Control MO), 12 (ATG-MO), 32 (SPL-MO)]. Each point represents a single fish. P values were calculated with Student’s t test. Scale bars, 500 μm. See also Supplemental Figs. S1D, E and S8. ATG-MO, translation initiation blocking morpholino oligonucleotide; SPL-MO, splice blocking morpholino oligonucleotide.

