

Abstract
We report the emission spectra, intensity decays, and anisotropy decay of 2,2′-dimethyl-p-terphenyl (DMT) with four-photon excitation. When excited with a fs Ti:Sapphire laser the emission intensity of DMT was found to depend on the third power of the incident intensity for excitation of 783 nm, and on the fourth power of the incident intensity for excitation at 882 nm. Surprisingly, at the highest value incident power, the emission intensity for four-photon excitation was about 10-fold less than with three-photon excitation. The emission spectra, intensity decays and correlation times were found to be identical for three- and four-photon excitation. However, the fundamental anisotropy (r0) of DMT depended on the mode of excitation. To the best of our knowledge, the r0 value of 0.70 is the highest ever observed for an isotropic solution. These results suggest that four-photon excitation can be used with red-NIR lasers to obtain excitation of UV-absorbing chromophores.
Introduction
Multiphoton absorption processes can be used to characterize the excited states of organic molecules.1–2 The interest in multiphoton excitation increased dramatically after it was shown that two-photon imaging was possible with laser scanning fluorescence microscopy.3–4 Since this time there has been intense activity in using multiphoton excitation in fluorescence spectroscopy.5 Two-photon excitation has been used to characterize biological macromolecules6–9 and tissues,10–12 and in biochemical assays.13–14 Simultaneously, the use of two-photon imaging was implemented by many other laboratories.15–17 Subsequently, three-photon excitation was shown to be useful in fluorescence spectroscopy18–20 and imaging.21–23 Additionally, there is an ongoing effort to design and synthesize fluorophores with improved two-photon cross sections for absorption.24–28
In the present report we describe the first observation of four-photon excitation. We examine the UV-absorbing chromophore 2,2′-dimethyl-p-terphenyl (DMT) which display a maximum absorbance near 250 nm, with the absorption ending near 300 nm. When excited with the 882 nm output of a fs Ti:Sapphire laser the emissive intensity depended on the fourth power of the incident intensity. The emission was demonstrated to be due to a direct four-photon process based on the steady state and time-resolved anisotropies. These results suggest that four-photon excitation can be useful for the study of UV-absorbing species.
Theory
It is useful to briefly review the theory for anisotropies with multiphoton excitation. The emission anisotropy depends on the extent of excitation photoselection and the angle between the excitation and emission transition moments (β). For z-axis polarized one-photon excitation the anisotropy is given by29–30
| (1) |
where θ is the angle from the z-axis, and β is the angle between the absorption and emission transition moments. The subscript zero indicates the absence of rotational diffusion during the excited-state lifetime or the time-zero anisotropy. The average value of cos2 θ depends on the type of photoselection and is given by excitation this distribution is given by
| (2) |
The term fi(θ) is the directional distribution of the excited state.29 For one-photon excitation this distribution is given by
| (3) |
and for one-photon excitation eq 1 becomes
| (4) |
The factor of 2/5 originates with cos2 θ or one-photon photoselection (eq 3). For collinear transitions (β = 0) the fundamental anisotropy (r01) without rotational diffusion is 0.40. For nonzero values of β the anisotropy ranges from 0.40 to–0.20 (Table 1).
TABLE 1:
Fundamental Anisotropies for One-, Two-, and Three-Photon Excitation
|
β (degrees) |
one-photon r01 |
two-photon r02 |
three-photon r03 |
four-photon r04 |
|---|---|---|---|---|
| 0 | 0.40 | 0.57 | 0.66a | 0.73 |
| 45 | 0.10 | 0.14 | 0.17 | 0.18 |
| 54.7 | 0.00 | 0.00 | 0.00 | 0.00 |
| 90 | −0.20 | −0.29 | −0.33 | −0.36 |
The anisotropy expected for multi-photon excitation can be calculated using
| (5) |
where i indicated the number of simultaneous absorbed photons. Substitution into eq 1 yields
| (6) |
| (7) |
| (8) |
For any number (i) of simultaneous absorption events the value of is given by
| (9) |
so that for β = 0
| (10) |
The anisotropy values for multiphoton excitation and for various values of β are given in Table 1. For collinear transitions multiphoton excitation is expected to result in a more highly oriented excited-state population than for one-photon excitation. Observation of a larger anisotropy than possible for three- or two-photon excitation provides strong evidence for four-photon excitation. The description in eqs 1–10 assumes that all transitions involve matrix elements with a single transition dipole orientation. For completeness we note that the anisotropy for two-photon excitation can be as high as 0.61.31–32 However, the simple theory described above is adequate for interpretation of these initial results.
Materials and Methods
2,2′-Dimethyl-p-terphenyl (DMT) was from Lambda Physics and was used without further purification. The solvents cyclohexane (Aldrich), hexadecane (Aldrich), and triacetin (Becker) were of spectroscopic grade. The concentration of DMT was 5 × 10⁻⁴ M. Emission spectra were recorded on a SLM 8000 spectrofluorometer with 10 nm band-pass. Solutions were in equilibrium with air and stirred during the measurements with Teflon-coated magnets.
Multiphoton excitation was accomplished with the fundamental output of Tsunami Ti:Sapphire laser from Spectra Physics, Inc. The pulse width was near 80 fs. The repetition rate of 80 MHz was held fixed by the lock-to-clock accessory. The Ti:Sapphire output (770 to 900 nm) was focused on the sample with a best form 2 cm confocal length lens. The beam waist was estimated to have a diameter of about 20 µm. The average excitation power was 0.5 W. This condition results in a pulse peak intensity of 2 × 1028 photon cm−2 s−1. For time-resolved measurements the emission was isolated with a combination of BG-39 and UG-11 filters transmitting from 320 to 370 (CVI, Inc.). For all measurements, the background signals from solvent references were less than 1.0%. All intensity and intensity decay measurements were performed using magic angle conditions, which is excitation with vertically polarized light and measurement of the emission through a polarizer oriented 54.7° from the vertical. Under these conditions the intensity and intensity decays are not affected by Brownian motion or the anisotropy decay of the sample. For measurements of the dependence of the emission on laser intensity, the peak power was attenuated with neutral density filters. To avoid any effect of widening the laser pulses by the filters, a single filter of the same design and thickness but varying optical density was used for the intensity measurements at various peak powers.
Frequency-domain intensity and anisotropy decays were obtained using the instrumentation described previously.33–34 The data were analyzed in terms of single exponential models
| (11) |
| (12) |
where τi is the decay time and θi is the rotational correlation time. The subscript i refers to the number of photons in the excitation process. The FD data were fit as described previously.35–36
Results
Emission spectra of DMT are shown in Figure 1 for one-photon excitation at 293 nm and for excitation at 882 nm. These emission spectra were obtained from the same solution of DMT, using the same instrument, the only difference being the excitation wavelength. The emission spectra are essentially identical for both modes of excitation. We believe the small difference in the emission spectra for one- and four-photon excitation is due to a different spatial distribution for the excited volume. Since the absorption of DMT in cyclohexane is essentially zero above 300 nm, it seems clear that this emission must result from three- or four-photon excitation.
Figure 1.
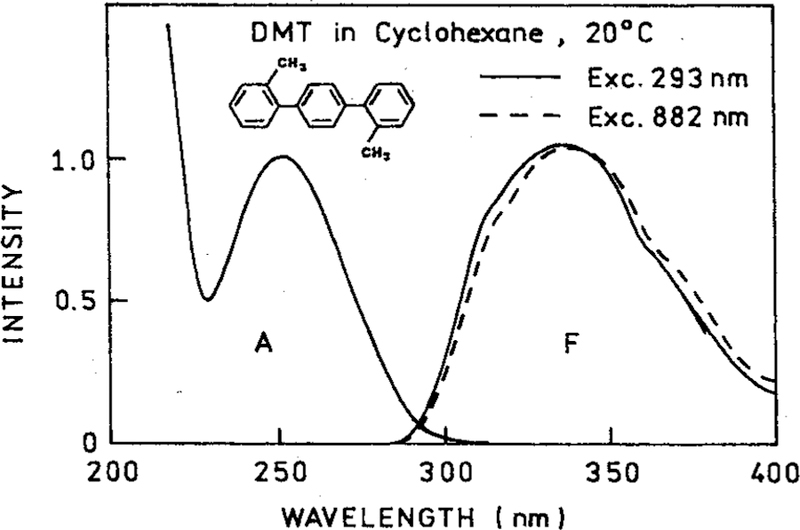
Absorption and emission spectra of DMT in cyclohexane. Also shown (– – –) is the emission spectrum with 884 nm excitation, which revealed a four-photon process.
To clarify the nature of the excitation process we examined the effect of attenuating the incident power at 882 nm. A 2-fold decrease in the incident power resulted in an over 15-fold decrease in the emission intensity of DMT (Figure 2). The extent of decrease is in close agreement with that expected for the 2.03-fold attenuation, that is a decrease by a factor of 17 due to the fourth-order dependence of the 2.03-fold attenuation. The dependence on incident power is obviously not in agreement with that expected for 1, 2, or 3-PE. For excitation at 793 nm the emission depended on the incident power cubed (Figure 3). For excitation at 882 nm the emission depended on the fourth power of the incident intensity. We further examined how the power dependence varied with excitation wavelength (Figure 4). As the excitation wavelength changes from 810 to 870 nm the power dependence shifted from the cubed dependence to a fourth-power dependence (Figure 4).
Figure 2.
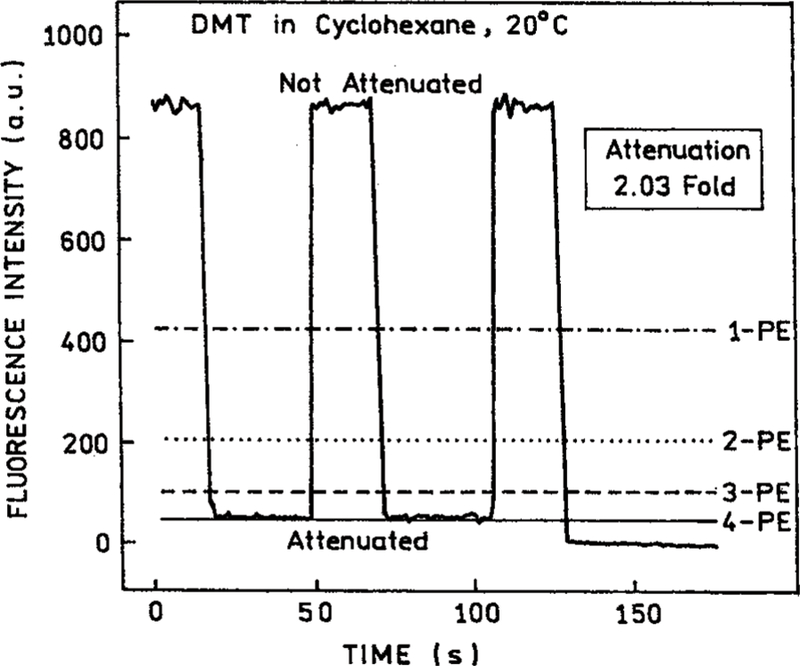
Fluorescence intensity of DMT in cyclohexane with and without a 2.03-fold attenuation of the 882 nm excitation intensity. The horizontal lines are the expectations for 1-PE (– • –), 2-PE (• • •), 3-PE (– – –), and 4-PE (–) excitation.
Figure 3.
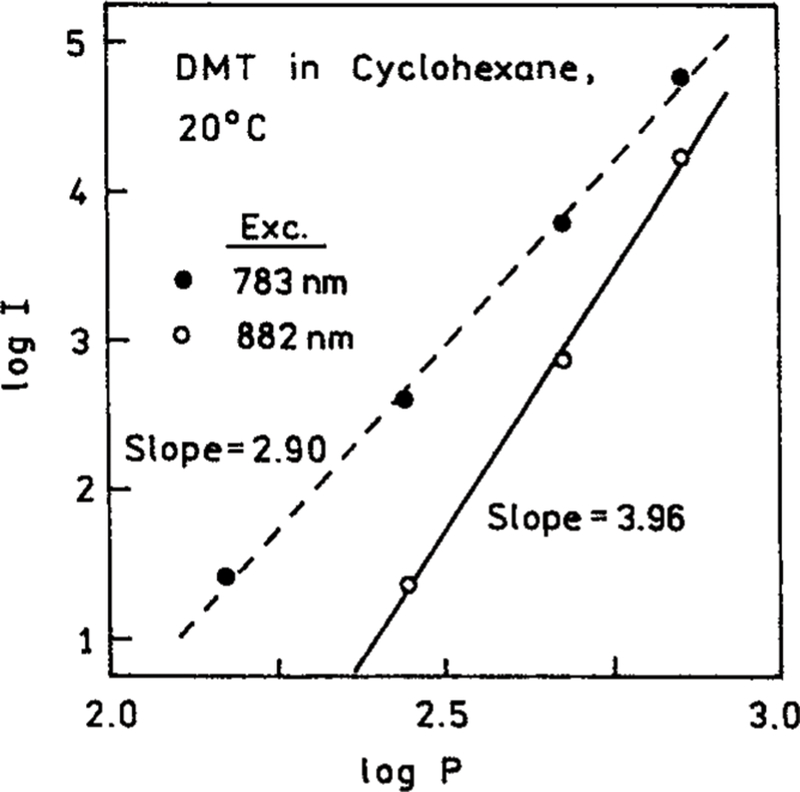
Dependence of the emission intensity of DMT on the excitation intensities at 783 and 882 nm. The power is in mW.
Figure 4.
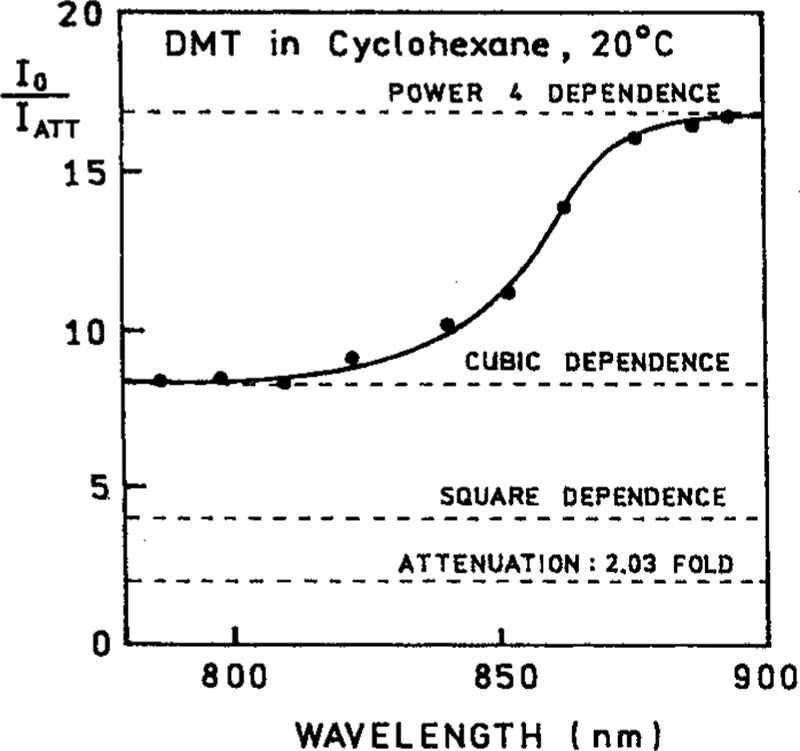
Effect of a 2.03-fold attenuation of the excitation light on the emission intensity of DMT in cyclohexane at 20 °C. The horizontal dashed lines show the expected values of I0/Iatt for 1-, 2-, 3-, and 4-photon excitation.
We questioned whether the DMT sample was being damaged by the intense 882 nm excitation needed for 4-PE. Hence we examined the intensity decays measured in the frequency domain (Figure 5). The same single-exponential decay was found for 3-PE at 783 nm and 4-PE at 882 nm. Additionally, the same single exponential decays were measured for 3-PE and 4-PE of DMT in hexadecane and triacetin (Table 2). These results suggest the DMT is not undergoing photochemical transformation to a different emitting species.
Figure 5.
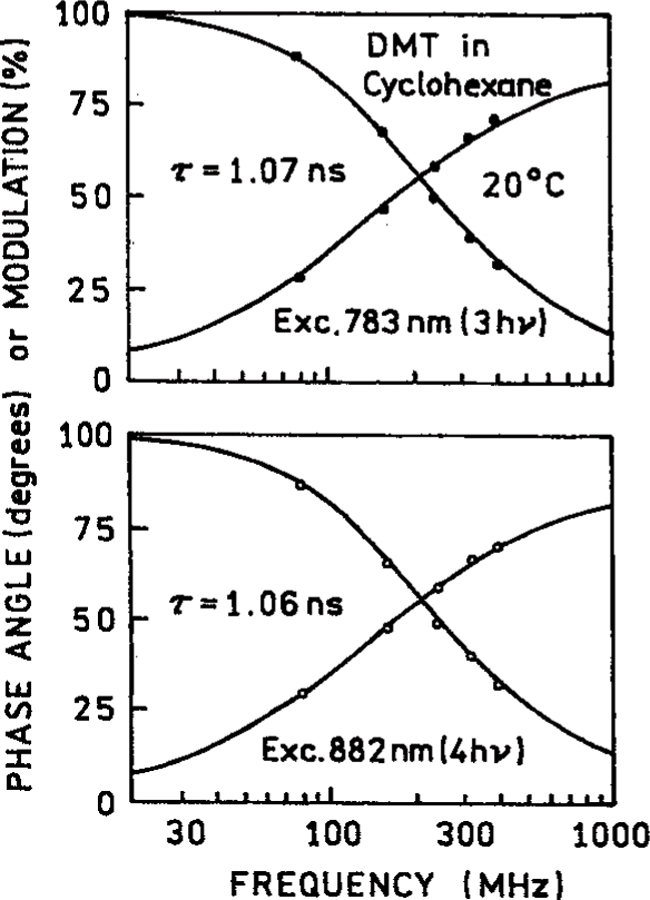
Frequency-domain intensity decays of DMT in cyclohexane with 3-PE at 783 nm and 4-PE at 882 nm.
TABLE 2:
Intensity and Anisotropy Decay Parameters of DMT in Cyclohexane, Hexadecane, and Triacetin for Three-and Four-Photon Excitation
| solvent | excitation (nm) | intensity decays τ (ns) | anisotropy decays |
|||
|---|---|---|---|---|---|---|
| r0 | θ (ns) | |||||
| cyclohexane | 783 | 1.07 (0.01)a | 1.7 | 0.53 (0.05) | 0.06 (0.03) | 0.9 |
| 882 | 1.06 (0.01) | 1.8 | 0.57 (0.03) | 0.10 (0.01) | 1.0 | |
| hexadecane | 783 | 1.12 (0.01) | 1.6 | 0.61 (0.03) | 0.11 (0.01) | 1.5 |
| 882 | 1.11 (0.01) | 2.8 | 0.69 (0.03) | 0.11 (0.01) | 1.5 | |
| triacetin | 783 | 1.15 (0.01) | 2.5 | 0.61 (0.02) | 0.79 (0.03) | 2.6 |
| 882 | 1.14 (0.01) | 1.5 | 0.70 (0.02) | 0.78 (0.03) | 1.5 | |
| triacetin | 783 | 0.61 (0.01) | ||||
| global fit | 882 | 0.70 (0.01) | 0.78 (0.02) | 2.4 | ||
The numbers in parentheses are the estimated uncertainities.
We examined the steady-state anisotropy of DMT in triacetin at 5° where rotational diffusion occurs (Figure 6) and at −50 °C where triacetin forms a rigid glass (Figure 6). Higher anisotropies were observed at lower temperature. The anisotropies of DMT at −55 °C for excitation near 830 and 870 nm are in good agreement with those expected for three- and four-photon excitation with collinear absorption and emission transition moments (Table 1). One can use the anisotropies in Figures 6 and 7 to calculate the rotational correlation time of DMT using the Perrin equation:
| (13) |
where r0 is the fundamental anisotropy observed at −50 °C, r is the anisotropy at 5 °C, and τ = 1.81 ns the lifetime at 5 °C. This calculation yields a correlation time of 3.3 and 3.4 ns for excitation at 830 and 870 nm, respectively. The closeness of these values suggests that the DMT solution does not undergo local heating at the intensities needed for four-photon excitation. The change in excitation from a three-photon to a four-photon process resulted in a less than 10-fold difference in emission intensities at the highest incident power. Incident powers about 1 W should result in higher emssion intensity for 882 nm illumination than for 793 nm illumination (Figure 4).
Figure 6.
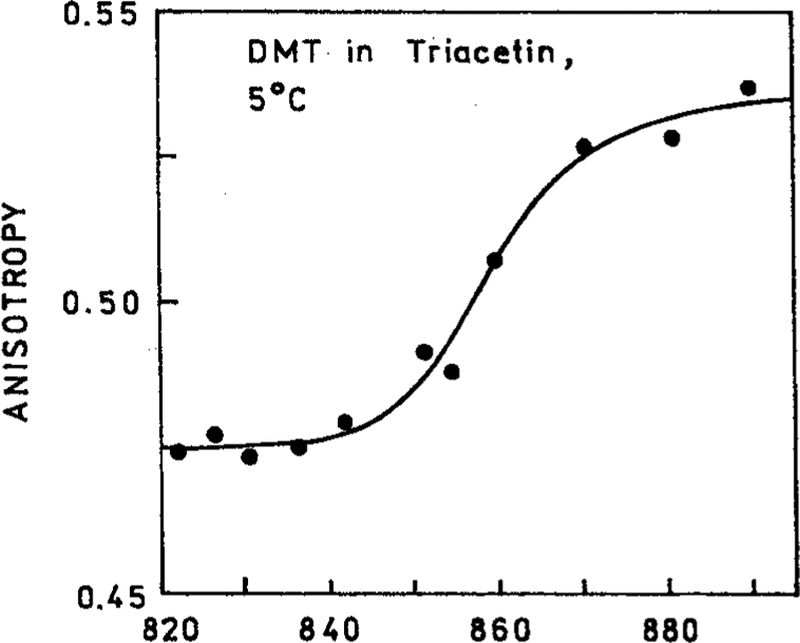
Excitation wavelength-dependent anisotropies of DMT in triacetin at 5 °C.
Figure 7.
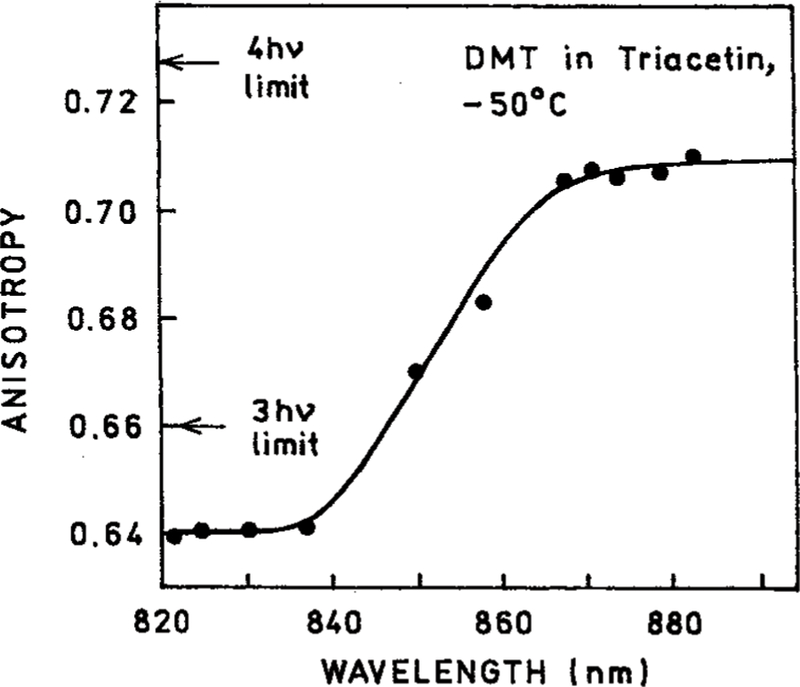
Excitation wavelength-dependent anisotropies of DMT in triacetin at −50 °C.
To further determine if the DMT samples were heated by illumination we measured the frequency–domain anisotropy decay in cyclohexane and triacetin (Figure 8). In all cases nearly the same time-zero anisotropies (r0) and correlation times were observed for three- and four-photon excitation (Table 2). The slightly different values of r0 and θ found for DMT in cyclohexane can be due to the shorter correlation times which are more difficult to measure. The fact that the anisotropy decays were the same for 3-PE and 4-PE is demonstrated by the ability to globally fit the FD anisotropy data for 783 and 882 nm excitation (Figure 9) to a single correlation time (Table 2). The closeness of the correlation times for different excitation wavelengths demonstrates that 4-PE can be accomplished without significant heating of the samples.
Figure 8.
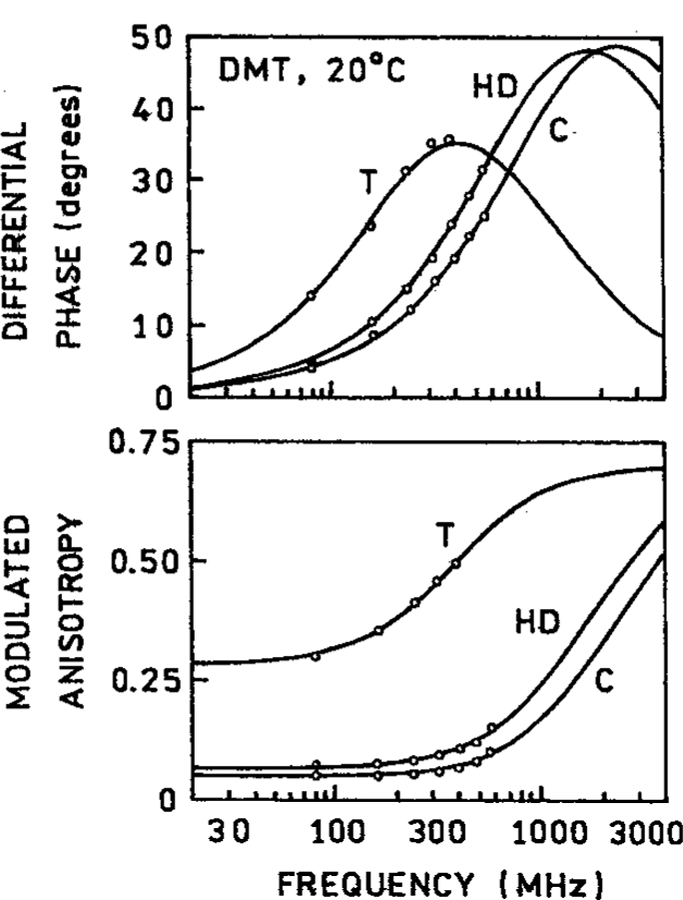
Frequency-domain anisotropy decays of DMT at 20 °C in cyclohexane (C), hexadecane (HD), and triacetin (T) at 20 °C.
Figure 9.
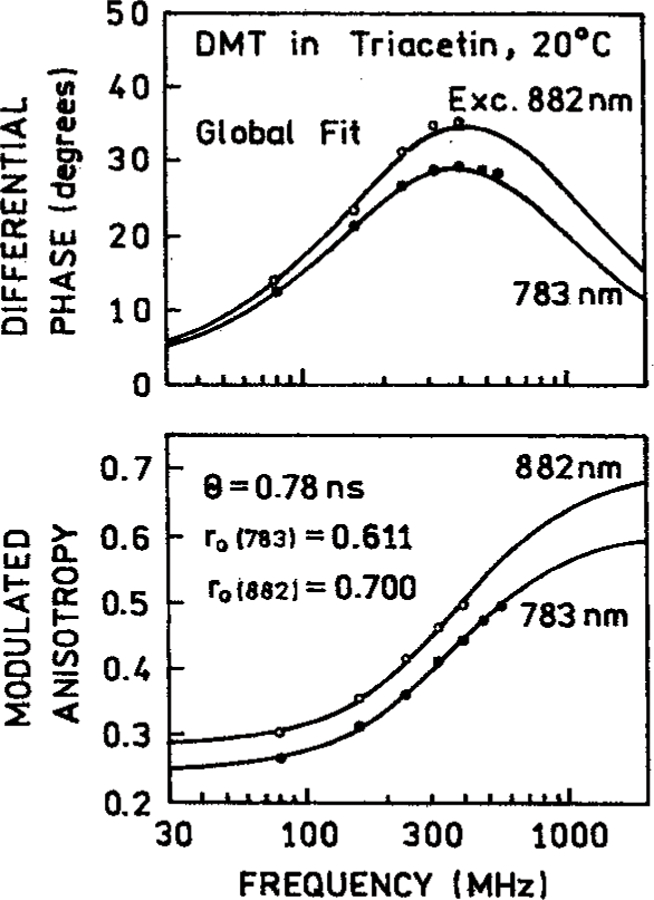
Global analysis of the frequency-domain anisotropy decay of DMT in triacetin with 3-PE at 783 nm and 4-PE at 882 nm.
The r0 values found for DMT with 4-PE are the largest yet observed in an isotropic solution. For one-photon excitation the maximum ratio of intensities of the parallel and perpendicularly polarized component of the emission is 3.0. It is interesting to see the relative magnitude of these components with four-photon excitation (Figure 10). The G-factor for our instrument was near unity, as can be seen from the vertical (IHV) and horizontal (IHH) components with horizontally polarized excitation (Figure 10, right side). For vertically polarized excitation the vertical (IVV) and horizontal (IVH) polarized components of the emission differ by 8-fold. Such high ratios for the vertical and horizontal components is an indication of the high degree of orientation of the excited-state transition moment distribution (Figure 11). As the mode of the excitation changes from 1-PE to 4-PE the fundamental anisotropy increases from 0.40 to 0.727.
Figure 10.
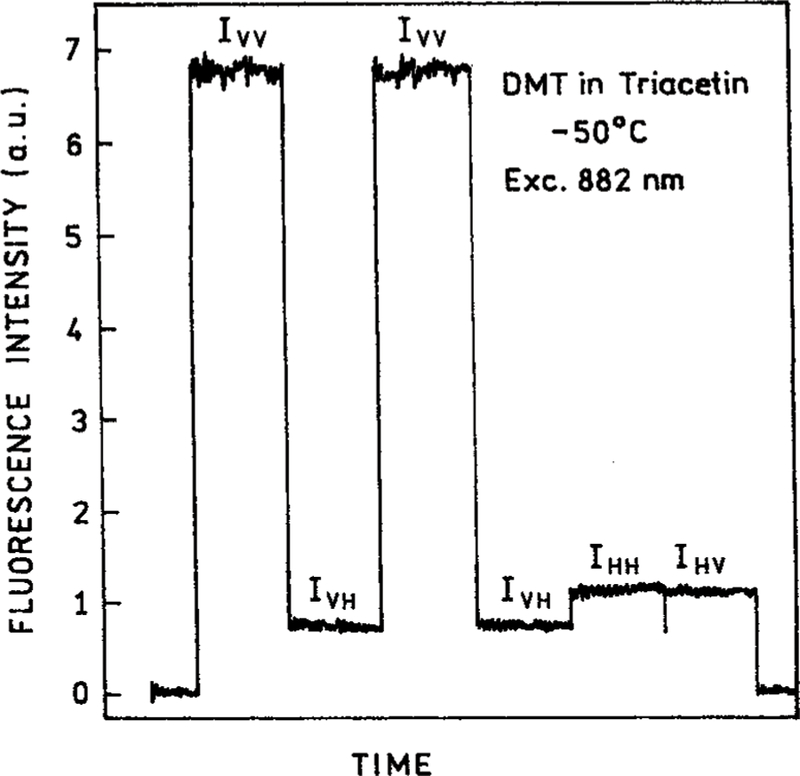
Emission intensities of the four polarized components of DMT with 882 nm excitation, in triacetin at −50 °C.
Figure 11.
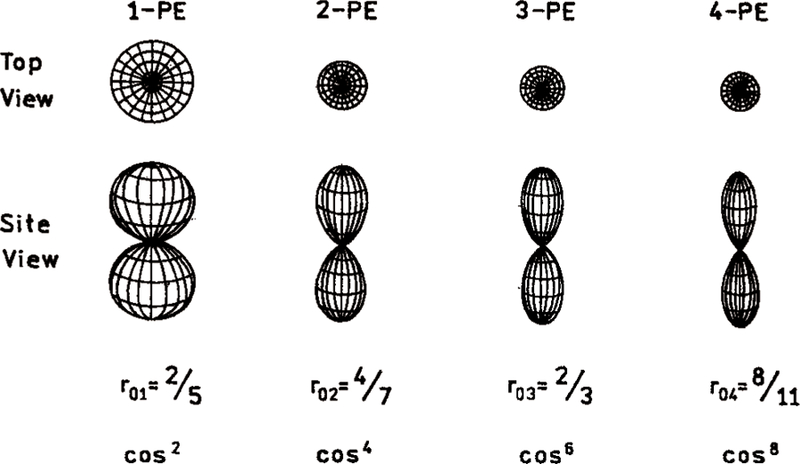
Theoretical distribution of the excited-state transition moments for 1-, 2-, 3-, and 4-photon excitation.
An important advantage of two-photon excitation microscopy is localized excitation at the focal point of the lens.3–4 This effect is due to the quadratic dependence on the illumination intensity. As a result one expects still greater excitation localization with higher modes of excitation. Figure 12 shows the calculated distribution of the excited-state population along the excitation beam. As the mode of absorption increases the excited-state population is expected to become more localized along the z-axis.
Figure 12.
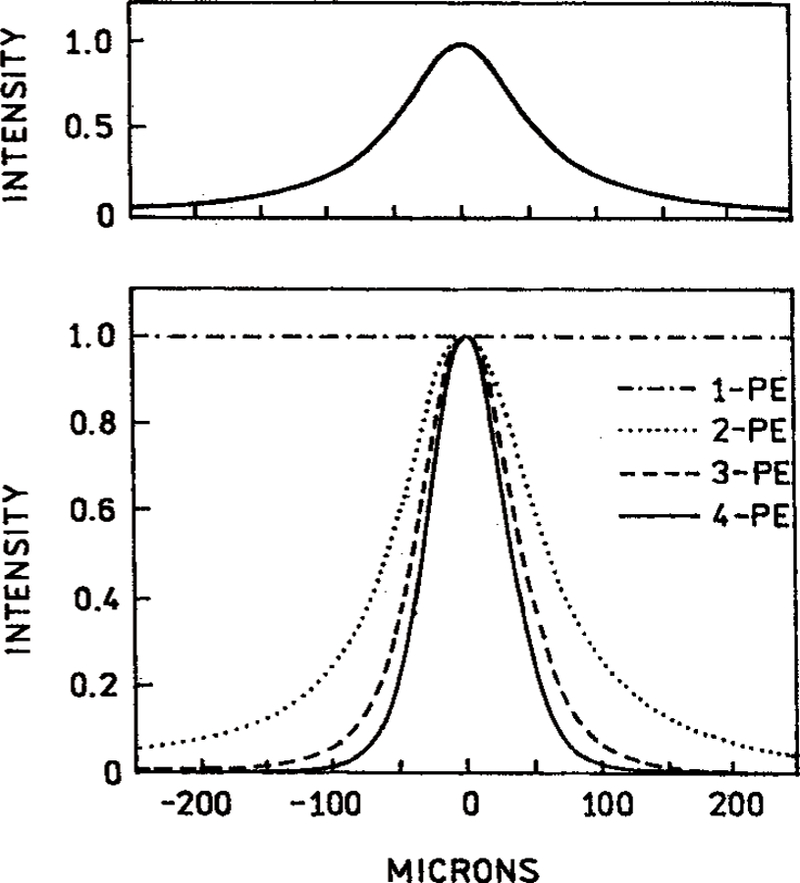
Theoretical predictions for the spatial distribution of excited fluorophores along the direction of the beam for 1-, 2-, 3-, and 4-photon excitation. The assumed Gaussian intensity distribution across the beam is shown in the upper panel.
We examined the excited state distribution along the excitation beam (Figure 13) and across the excitation beam (Figure 14). We scanned images of the fluorescence spots using a 50 µ precision air slit along the beam and a 10 µ pinhole across the beam. These measurements were all performed with the same excitation wavelength of 882 nm. We obtained 2-PE using perylene, 3-PE using PPO, and 4-PE using DMT. These data demonstrate that at the same excitation wavelength, more localized excitation can be obtained with a higher mode of excitation. Importantly, the intensities rapidly decrease to zero at short distances from the center of the laser beam.
Figure 13.
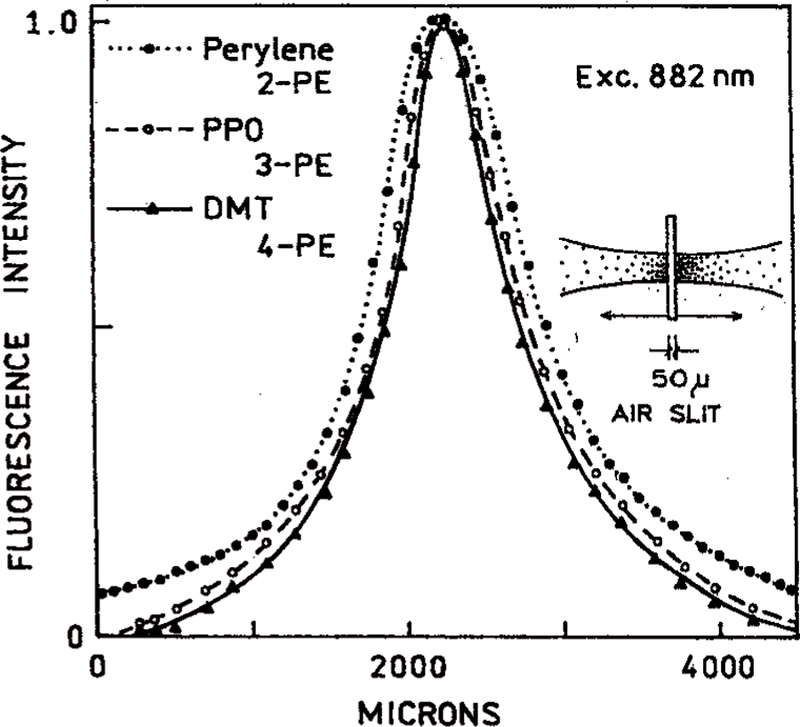
Measured spatial intensity distribution along the laser beam arise for 882 nm excitation. This wavelength provides 2-PE of perylene, 3-PE of PPO, and 4-PE of DMT.
Figure 14.
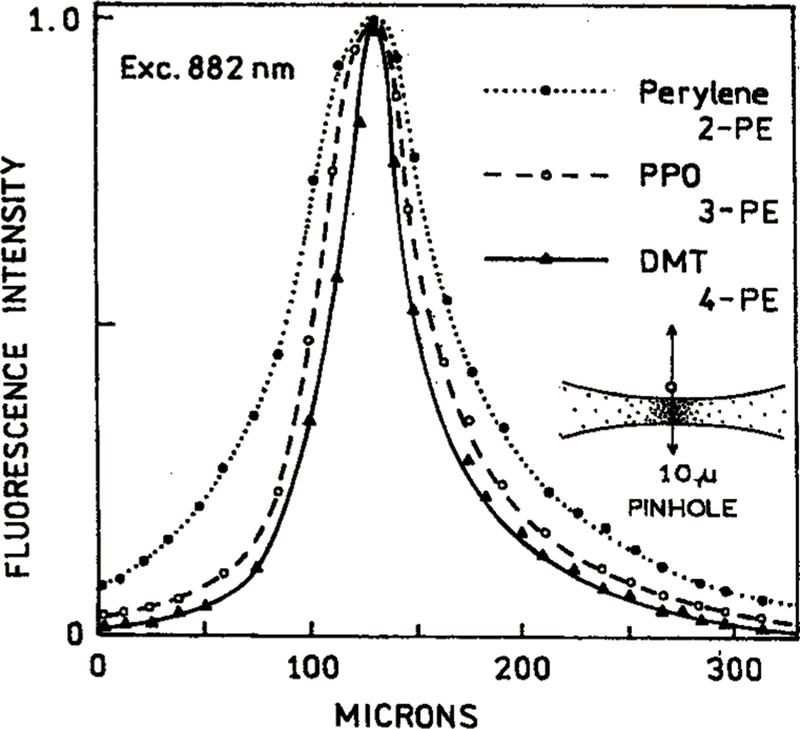
Measured distribution of intensities across the laser beam with 882 nm excitation. This wavelength provides 2-PE of perylene, 3-Pe of PPO, and 4-PE of DMT.
Discussion
Our observation of four-photon excitation has implications for the use of multiphoton excitation in spectroscopy and imaging. For example, we have shown the emission from saturated alkanes can be observed with excitation near 300 nm via two-photon excitation.37–39 It would be difficult to obtain good transmission of 300 nm through a microscope objective. However, higher-order three- or four-photon excitation of saturated hydrocarbons may allow detection of deep UV emission from cellular membranes in an optical microscope.
The high anisotropies possible with 4-PE may also be useful in cellular imaging. It is possible to accomplish anisotropy imaging in laser scanning microscopy.40 As shown in Figure 10 there is an approximate 8-fold intensity difference between the parallel (V) and perpendicular (H) components of the polarized emission. Such large intensity differences should facilitate the use of anisotropy measurements in cell imaging.
Acknowledgment.
This work ws supported by the NIH, National Center for Research Resources, RR-08119.
Footnotes
Abbreviations: DMT, 2,2′-dimethyl-p-terphenyl; FD, frequency-domain; 1-, 2-, 3-, and 4-PE, one-, two-, three-, or four-photon excitation; PPO, 2,5-diphenyloxazole.
References and Notes
- (1).Fredrich DM Two-photon molecular spectroscopy. J. Chem. Educ 1982, 59, 472–481. [Google Scholar]
- (2).Callis PE Two-photon-induced fluorescence. Annu. ReV. Phys. Chem 1997, 48, 271–297. [DOI] [PubMed] [Google Scholar]
- (3).Denk W; Strickler JH; Webb WW Two-photon laser scanning fluorescence microscopy. Science 1990, 248, 73–76. [DOI] [PubMed] [Google Scholar]
- (4).Xu C; Webb WW Multiphoton excitation of molecular fluorophores and nonlinear laser microscopy In Topics in Fluorescence Spectroscopy; Vol. 5: Nonlinear and Two-Photon-Induced Fluorescence; Lakowicz JR, Ed.; Plenum Press: New York, 1997; pp 471–540. [Google Scholar]
- (5).Topics in Fluorescence Spectroscopy; Vol. 5: Nonlinear and Two-Photon-Induced Fluorescence; Lakowicz JR, Ed.; Plenum Press: New York, 1997; 544 pp. [Google Scholar]
- (6).Walla PJ; Yom J; Krueger BP; Fleming GR Two-photon excitation spectrum of light-harvesting complex II and fluorescence upconversion after one- and two-photon excitation of the carotenoids. J. Phys. Chem. B 2000, 104, 4799–4806. [Google Scholar]
- (7).Bagatolli L; Gratton E; Khan TK; Chong PL-G Two-photon fluorescence microscopy studies of bipolar tetraether giant liposomes from thermoacidophilic archaebacteria Sulfolobus acidocaldarius. Biophys. J 2000, 79, 416–425. [DOI] [PMC free article] [PubMed] [Google Scholar]
- (8).Bagtolli LA; Gratton E Two-photon fluorescence microscopy of coexisting lipid domains in giant unilamellar vesicles of binary phospholipid mixtures. Biophys. J 2000, 78, 290–305. [DOI] [PMC free article] [PubMed] [Google Scholar]
- (9).Brown EB; Wu ES; Zipfel W; Webb WW Measurement of molecular diffusion in solution by multiphoton fluorescence photobleaching recovery. Biophys. J 1999, 77, 2837–2849. [DOI] [PMC free article] [PubMed] [Google Scholar]
- (10).Teuchner K; Freyer W; Leupold D; Volkmer A; Birch DJS; Altmeyer P; Stücker M; Hoffman K Femtosecond two-photon excited fluorescence of melanin. Photochem. Photobiol 1999, 70 (2), 146–151. [PubMed] [Google Scholar]
- (11).Masters BR; So PTC; Gratton E Multiphoton excitation fluorescence microscopy and spectroscopy of in vivo human skin. Biophys. J 1997, 72, 2405–2412. [DOI] [PMC free article] [PubMed] [Google Scholar]
- (12).Guo Y; Wang QZ; Zhadin N; Liu F; Demos S; Calistru D; Tirskliunas A; Katz A; Budansky Y; Ho PP; Alfano RR Two-photon excitation of fluorescence from chicken tissue. Appl. Opt 1997, 36, 968–970. [DOI] [PubMed] [Google Scholar]
- (13).Baker GA; Pandey S; Bright FV Extending the reach of immunoassays to optically dense specimens by using two-photon excited fluorescence polarization. Anal. Chem 2000, 72, 5748–5752. [DOI] [PubMed] [Google Scholar]
- (14).Okerberg E; Shear JB Attomole-level protein fingerprinting based on intrinsic peptide fluorescence. Anal. Chem 2001, 73, 1610–1613. [DOI] [PubMed] [Google Scholar]
- (15).Fan GY; Fujisaki H; Miyawaki A; Tsay R-K; Tsien RY; Ellisman MH Video-rate scanning two-photon excitation fluorescence microscopy and ratio imaging with cameleons. Biophys. J 1999, 76, 2412–2420. [DOI] [PMC free article] [PubMed] [Google Scholar]
- (16).Diaspro A Introduction to two-photon microscopy. Microscopy Res. Technique 1999, 47, 163–164. [DOI] [PubMed] [Google Scholar]
- (17).So PTC; Dong CY; Masters BR; Berland KM Two-photon excitation fluorescence microscopy. Annu. ReV. Biomed. Eng 2000, 02, 399–429. [DOI] [PubMed] [Google Scholar]
- (18).Lakowicz JR; Gryczynski I; Malak H; Schrader M; Engel-hardt P; Kano H; Hell SW Time-resolved fluorescence spectroscopy and imaging of DNA labeled with DAPI and Hoechst 33342 using three-photon excitation. Biophys. J 1997, 72, 567–578. [DOI] [PMC free article] [PubMed] [Google Scholar]
- (19).Szmacinski H; Gryczynski I; Lakowicz JR Three-photon induced fluorescence of the calcium probe Indo-1. Biophys. J 1996, 70, 547–555. [DOI] [PMC free article] [PubMed] [Google Scholar]
- (20).Gryczynski I; Malak H; Lakowicz JR; Cheung HC; Robinson J; Umeda PK Fluorescence spectral properties of troponin C mutant F22W with one-, two-, and three-photon excitation. Biophys. J 1996, 71, 3448–3453. [DOI] [PMC free article] [PubMed] [Google Scholar]
- (21).Gryczynski I; Malak H; Lakowicz JR Multiphoton excitation of the DNA stains DAPI and Hoechst. Bioimaging 1996, 4, 138–148. [Google Scholar]
- (22).Wokosin DL; Centoze VE; Crittenden S; White J Three-photon excitation fluorescence imaging of biological specimens using an all-solid-state laser. Bioimaging 1996, 4, 208–214. [Google Scholar]
- (23).Maiti S; Shear JB; Williams RM; Zipfel WR; Webb WW Measuring serotonin distribution in live cells with three-photon excitation. Science 1997, 275, 530–532. [DOI] [PubMed] [Google Scholar]
- (24).Belfield KD; Hagan DJ; Van Stryland EW; Schafer KJ; Negres RA New two-photon absorbing fluorene derivatives: synthesis and nonlinear optical characterization. Org. Lett 1999, 1 (10), 1557–1578. [Google Scholar]
- (25).Rumi M; Ehrlich JE; Heikai AA; Perry JW; Barlow S; Hu Z; McCord-Maughon D; Parker TC; Röckel H; Thayumanavan S; Marder SR; Beljonne D; Brédas J-L Structure-property relationships for two-photon absorbing chromophores: bis-donor diphenylopolyene and bis(styryl)benzene derivatives. J. Am. Chem. Soc 2000, 122, 9500–9510. [Google Scholar]
- (26).Chung S-J; Kim K-S; Lin T-C; He GS; Swiatkiewicz J; Prasad PN Cooperative enhancement of two-photon absorption in multi-branched structures. J. Phys. Chem. B 1999, 103, 10741–10745. [Google Scholar]
- (27).Belfield KD; Schafer KD; Mourad W; Reinhardt BA Synthesis of new two-photon absorbing fluorene derivatives via Cu-mediated Ullmann condensations. J. Org. Chem 2000, 65 (15), 4475–4481. [DOI] [PubMed] [Google Scholar]
- (28).Adronov A; Fréchet JMJ Novel two-photon absorbing dendritic structures. Chem. Mater 2000, 12, 2838–2841. [Google Scholar]
- (29).Lakowicz JR,; Gryczynski I; Gryczynski Z; Danielsen E; Wirth MJ Time-resolved fluorescence intensity and anisotropy decays of 2.5 diphenyloaxozole by two-photon excitation and frequency-domain fluorometry. J. Phys. Chem 1992, 98, 3000–3006. [DOI] [PMC free article] [PubMed] [Google Scholar]
- (30).Weber G Polarization of the fluorescence of solutions In Fluorescence and Phosphorence Analysis: Principles and Applications; Interscience Publishers: New York, 1966; pp 217–240. [Google Scholar]
- (31).Callis PR On the theory of two-photon induced fluorescence anisotropy with application to indoles. J. Chem. Phys 1993, 21, 61–78. [Google Scholar]
- (32).Chen S-Y; Van Der Meer BW Theory of two-photon induced fluorescence anisotropy decay in membranes. Biophys. J 1993, 64, 1567–1575. [DOI] [PMC free article] [PubMed] [Google Scholar]
- (33).Lakowicz JR; Maliwal BP Construction and performance of a variable-frequency phase-modulation fluorometer. Biophys. Chem 1985, 21, 61–78. [DOI] [PubMed] [Google Scholar]
- (34).Laczko G; Lakowicz JR; Gryczynski I; Gryczynski Z; Malak HA 10 Ghz frequency-domain fluorometer. ReV. Sci. Instrum 1990, 61, 2331–2337. [Google Scholar]
- (35).Gratton E; Lakowicz JR; Maliwal BP; Cherek H; Laczko G; Limkeman M Resolution of mixtures of fluorophores using variable-frequency phase shift and modulation data. Biophys. J 1984, 46, 479–486. [DOI] [PMC free article] [PubMed] [Google Scholar]
- (36).Lakowicz JR; Cherek H; Kusba J; Gryczynski I; Johnson ML Review of fluorescence anisotropy decay analysis by frequency-domain fluorescence spectroscopy. J. Fluoresc 1993, 3, 103–116. [DOI] [PubMed] [Google Scholar]
- (37).Lakowicz JR; Gryczynski I Fluorescence intensity decays of cyclohexane and methylcyclohexane with two-photon excitation from a high repetition rate frequency-doubled dye laser. Biospectrosc 1995, 1, 3–8. [Google Scholar]
- (38).Gryczynski I; Lakowicz JR Quenching of methylcyclohexane fluorescence by methanol. Photochem. Photobiol 1995, 3, 426–432. [Google Scholar]
- (39).Gryczynski I; Razynska A; Lakowicz JR Two-photon induced fluorescence of linear alkanes: A possible intrinsic lipid probe. Biophys. Chem 1996, 57, 291–295. [DOI] [PubMed] [Google Scholar]
- (40).Toyonaga S; Nakano Y Imaging of rotational Brownian motion of bimolecules in living cells using fluorescence depolarization microscopy. Proc. SPIE-Int. Soc. Opt. Eng 1999, 3260, 84–95. [Google Scholar]