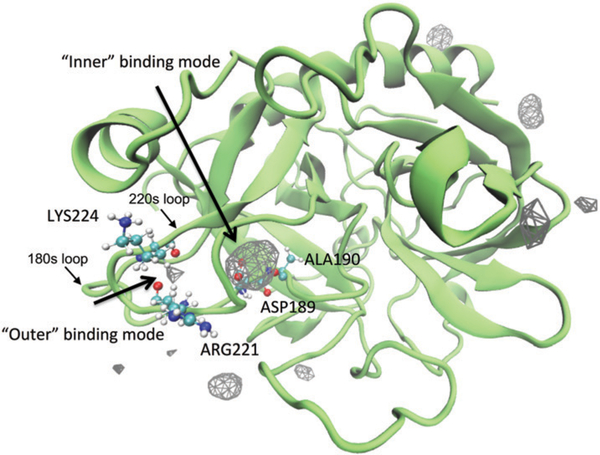
Fig. 1.
A density map of Na+ around thrombin. To show the density map as isosurfaces, a fractional occupancy of 0.05 was used as the isovalue. The protein is shown as the structure closest to the average structure in the simulations. Two different interior binding modes are identified between 220s and 180s loops. They are referred to as “outer” and “inner” binding modes in the following context. The residues accommodate these two binding modes are indicated by the labels beside their CPK representations.

