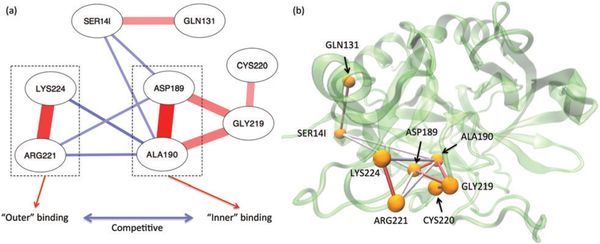
Fig. 2.
Cooperativity in Na+ bindings. Panel (a) illustrates the giant component of the thrombin residues’ coupling network with respect to number of bound Na+. Panel (b) shows these coupling on the structure plot. The red and blue lines on both panels represent the positive and negative correlations respectively. A darker and thicker line indicates a stronger coupling.

