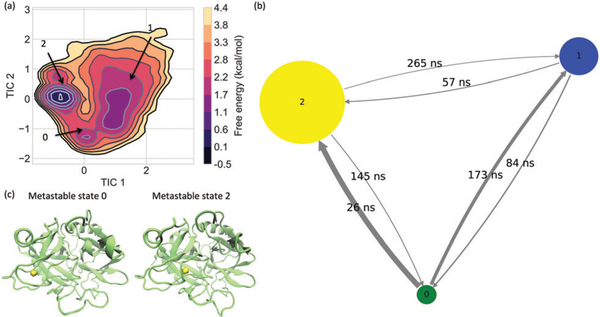
Fig. 4.
Metastable states from Hidden Markov modeling. (a) Three metastable states are identified from the free energy surface constructed along the first TICA components. The transition among these three metastable states are illustrated in panel (b), where the size of nodes and the thickness of the transition arrows are respectively proportional to the stationary probability of the corresponding states and transition matrix. The quantities above the arrows indicate the mean first passage times from one state to another. Structural representations for the Na+-bound metastable states are shown in panel (c), where the bound Na+ are indicated by the yellow isosurfaces with a number density of 0.5.

