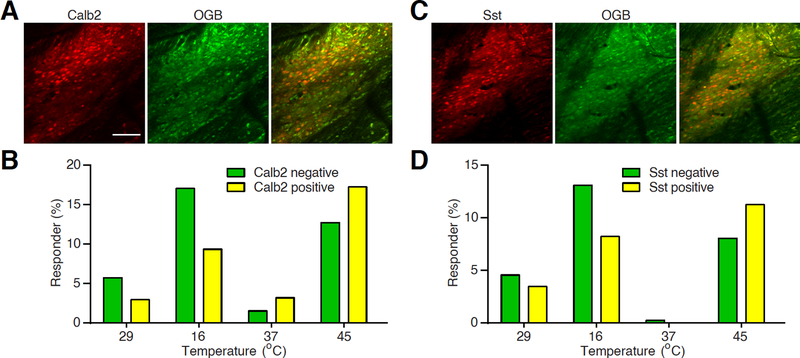
Figure 4 |. Responses of spinal Sst+ and Calb2+ neurons to thermal stimuli.
A. Example two-photon images of OGB-labeled Calb2+ and Calb2− neurons. Scale bar, 100 μm.
B. A histogram showing the percentage of Calb2+ and Calb2− neurons that respond to corresponding temperature stimuli.
C. Example two-photon images of OGB-labeled Sst+ and Sst− neurons.
D. A histogram showing the percentage of Sst+ and Sst− neurons that respond to corresponding temperature stimuli.

