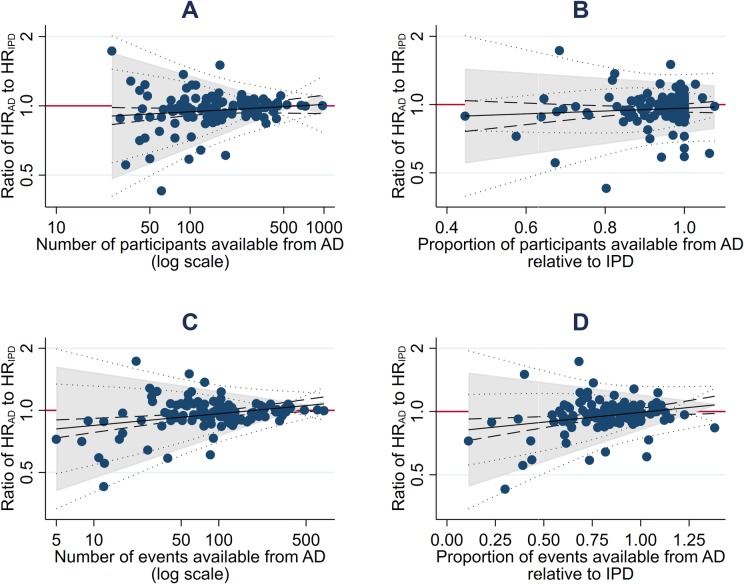
Fig 2. Potential predictors of the extent of agreement between trial HRs from AD and IPD.
Bland–Altman plots showing how the ratio of the HR from AD to the HR from IPD varies according to the number of participants (A) and events (C) available from AD, and the proportion of participants (B) and events (D) available from AD relative to IPD. The red horizontal lines represent no difference (i.e., a ratio of 1). The shaded areas represent the 95% Bland–Altman limits of agreement, with fitted linear dependence upon the value of the covariate. Dashed and dotted lines represent statistical precision around the average ratios and the limits of agreement, respectively. AD, aggregate data; HR, hazard ratio; IPD, individual participant data.

