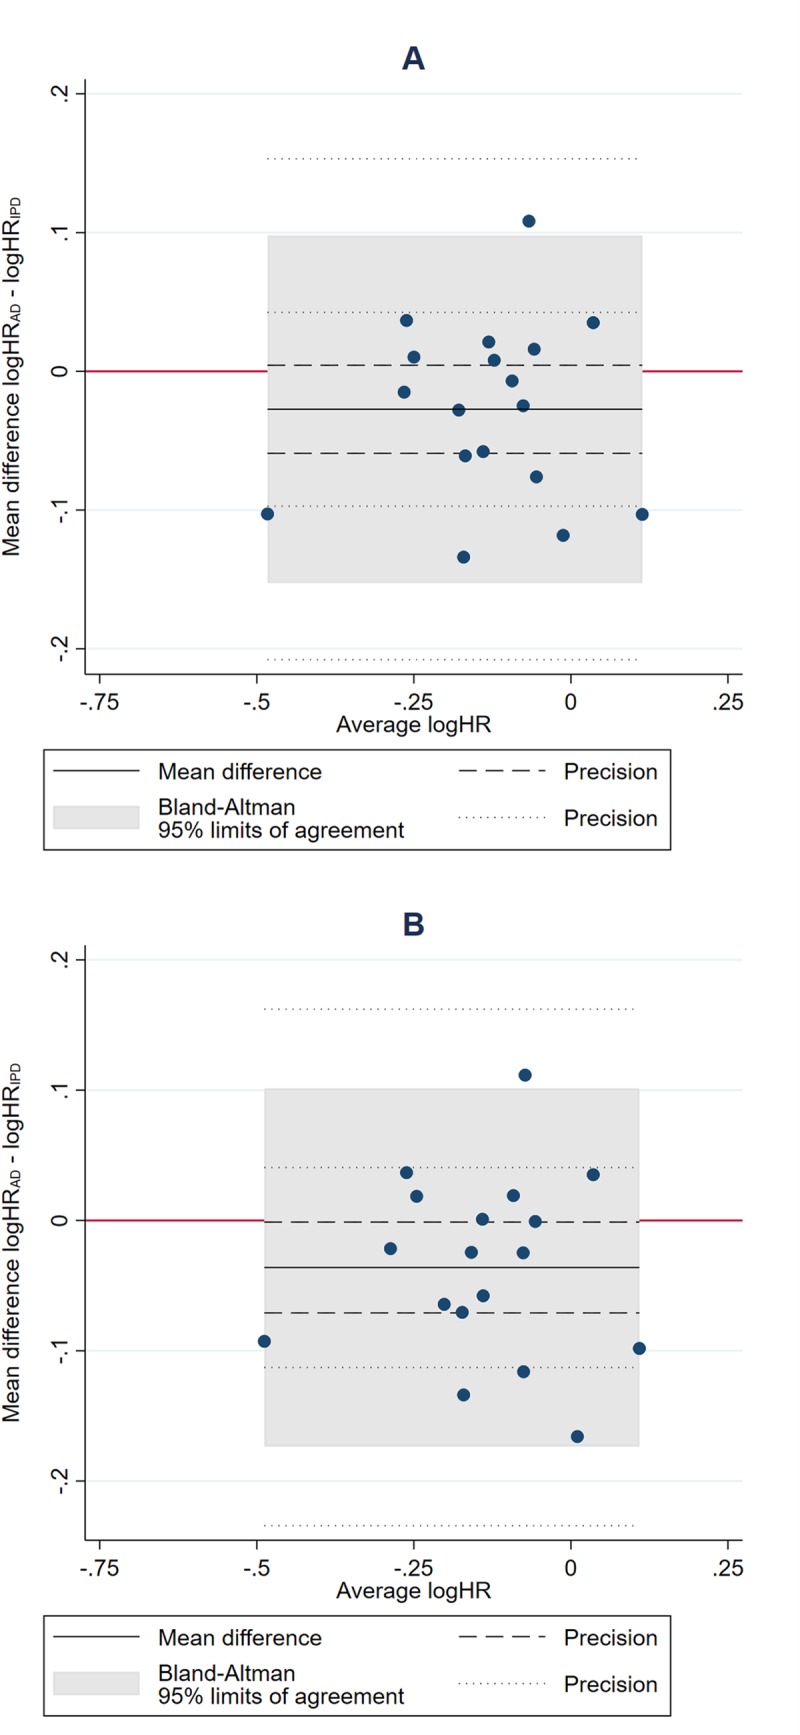
Fig 4. Comparison of meta-analysis HRs from AD versus IPD.

Bland–Altman plots showing how the ratio of the HR from AD to the HR from IPD, as estimated by fixed-effect (A) and random-effects models (B), respectively, varies with the average HR (i.e., the geometric mean of the 2 HR estimates). The red horizontal line represents no difference (i.e., a ratio of 1). The shaded area represents the 95% Bland–Altman limits of agreement. Dashed and dotted lines represent statistical precision around the average ratio and the limits of agreement, respectively. AD, aggregate data; HR, hazard ratio; IPD, individual participant data.
