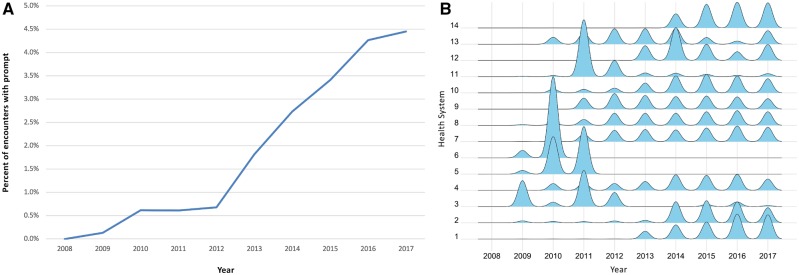
Figure 4.
(A) Use of smoking history prompt. For the 14 health systems with more than 100 encounters that used the smoking history prompt, we express the number of smoking history prompts per year as a percentage of total encounters in the same year. (B) Annual smoking history documentation by health system. Ridges plot showing frequency of usage of smoking history by health system as a function of time. Each ridgeline is a density plot for the events of the indicated health system. Each plot is scaled by the data from that health system.

