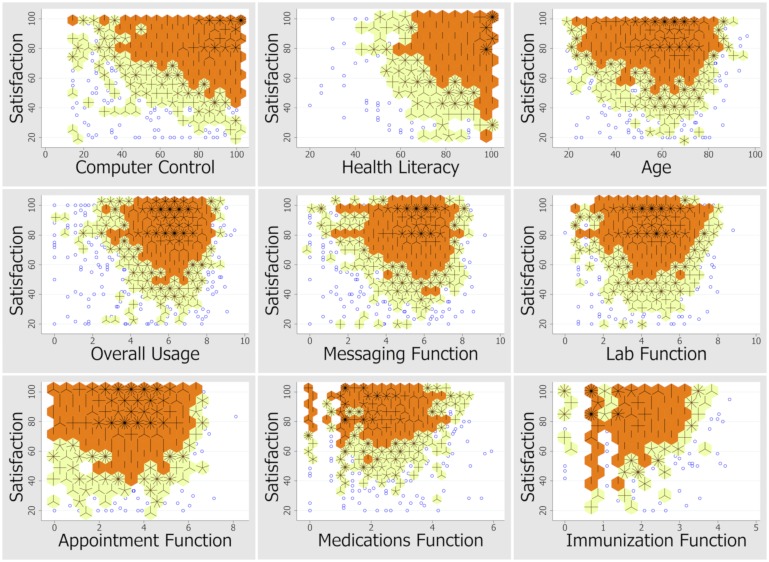
Figure 4.
Relationship of satisfaction with patient characteristics and portal usage. Density distribution sunflower plots visualize the nonlinear, bivariate, relationships of satisfaction scores against computer control, health literacy, age, usage, and demographics. Darker regions (orange hexagons) with more petals (hash marks) indicate a higher density of responses.

