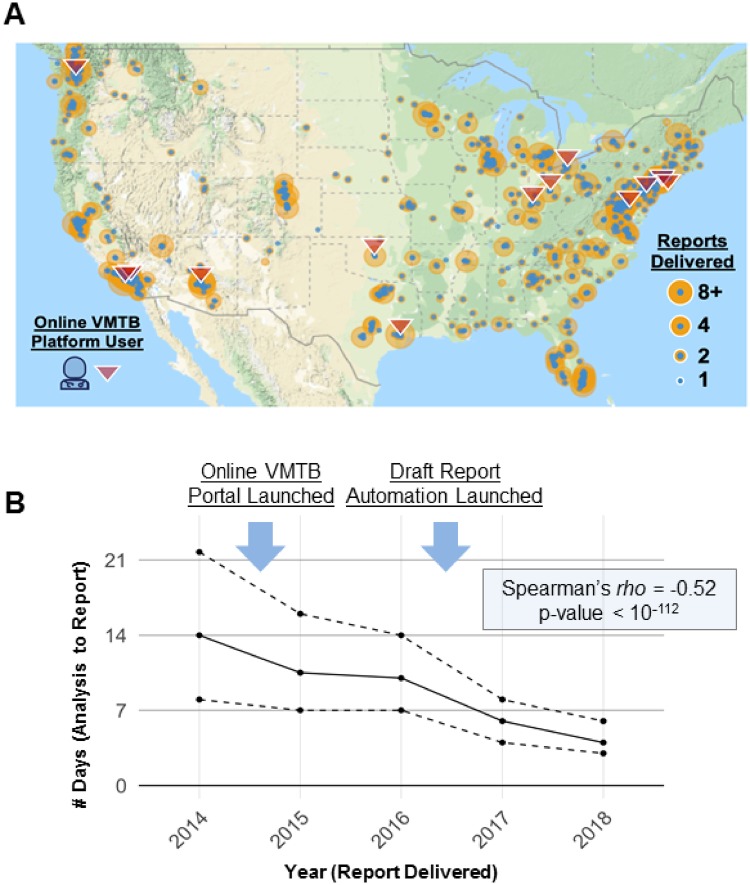
Figure 4.
Overcoming geographical and logistical barriers using a scalable platform for precision oncology. (A) Geo map generated using Google Maps shows the spread of clinics where patients were seen for the cohort analysis presented in this study. Over 200 academic and community oncology practices (blue dots) were able to take advantage of the expertise of a small group of oncologists trained in precision oncology (red triangles) to deliver personalized treatment options to their patients. (B) After receiving molecular testing results and past medical and treatment history, turnaround time for case review by VMTB users decreased from a median of 14 days in 2014 to 4 days in 2018. Turnaround time was evaluated as the number of days between starting step 3 and completing step 8 as described in Figure 1. The solid line represents the median turnaround time and dashed lines represent 25th and 75th percentiles. A significant negative correlation (Spearman’s rho = −0.52; P = 2.9 × 10−113) was observed between the year of report delivery and the turnaround time.

