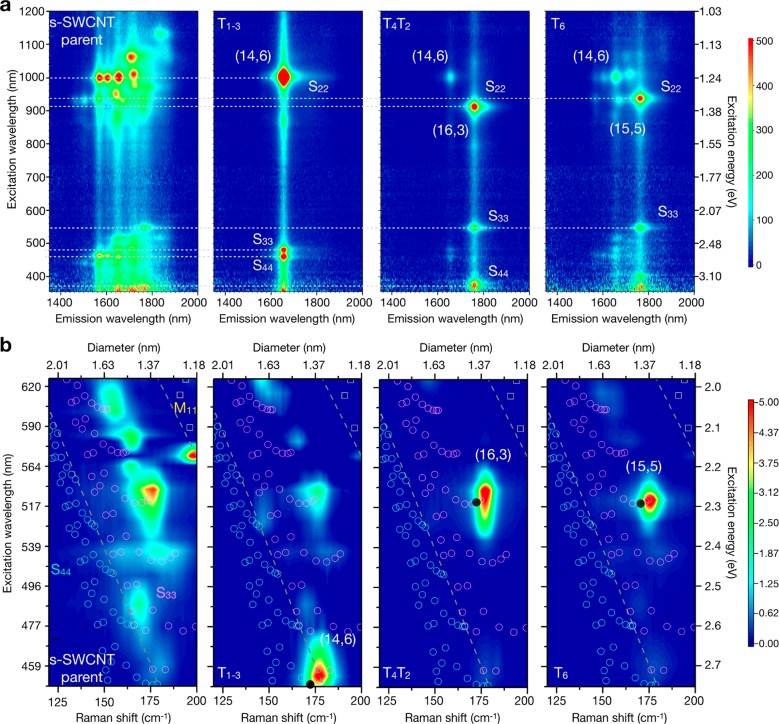
Figure 4.
Optical characterization of fractions obtained from the semiconducting C16H34@EA parent. (a) Photoluminescence excitation (PLE) map and (b) radial breathing mode (RBM) resonance Raman maps constructed from spectra at 20 different excitation energies. A dashed line indicates excitation via S22, S33, or S44 in the PLE maps and divides energy ranges where the resonance of S44, S33, and M11 is expected in the Raman maps. The cyan (S44) and magenta (S33) open circles and yellow (M11) open squares are from the Kataura plot and indicate the transition energy as a function of tube diameter. A solid circle indicates the expected Raman shift for the (n,m) species displayed.

