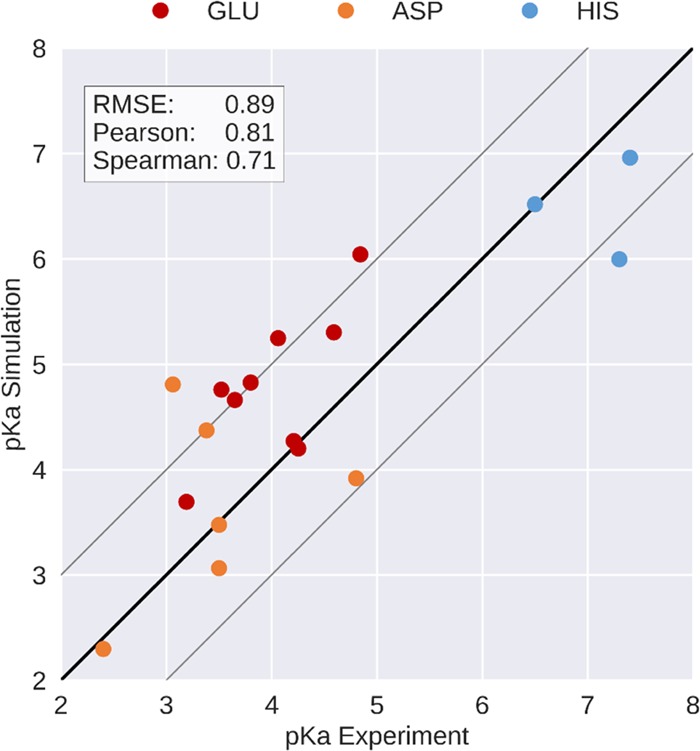
Figure 3.

Correlation plot between the pKa values measured by NMR and predicted by simulation. Pearson and Spearman correlation coefficients and RMSE are shown. The black line denotes the ideal correlation and gray lines denote the prediction error margin of ±1 pKa unit, as typically reported in the literature.
