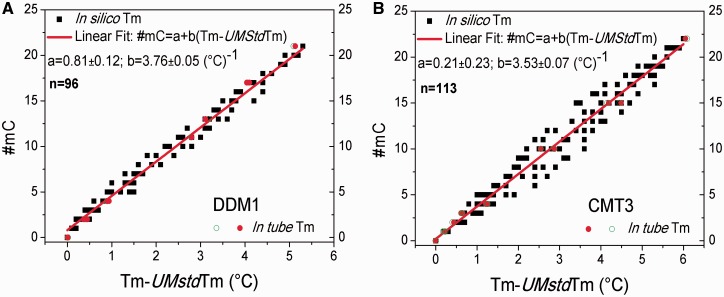
Figure 3.
The #mC values obtained from simulated melting profiles (black squares) and from experiments (red and green empty circles) as a function of (Tm − UMstd Tm) for DDM1(A) and CMT3(B). The red line is the result of a linear fitting procedure of the simulated data under the hypothesis that the linear dependence #mC = a + b (Tm − UMstd Tm) holds (see text). Fitting parameters for DDM1(n = number of values used to build the model = 96): a = 0.81 ± 0.12 and b = 3.76 ± 0.05 (°C)−1 with R = 0.993. Fitting parameters for CMT3(n = 113): a = 0.21 ± 0.23 and b = 3.53 ± 0.07 (°C)−1 with R = 0.978. The P value corresponding to the observed R value of both built models is lower than 0.0001, which confirms the high significance of the hypothesized linear relationship.

