Figure 2:
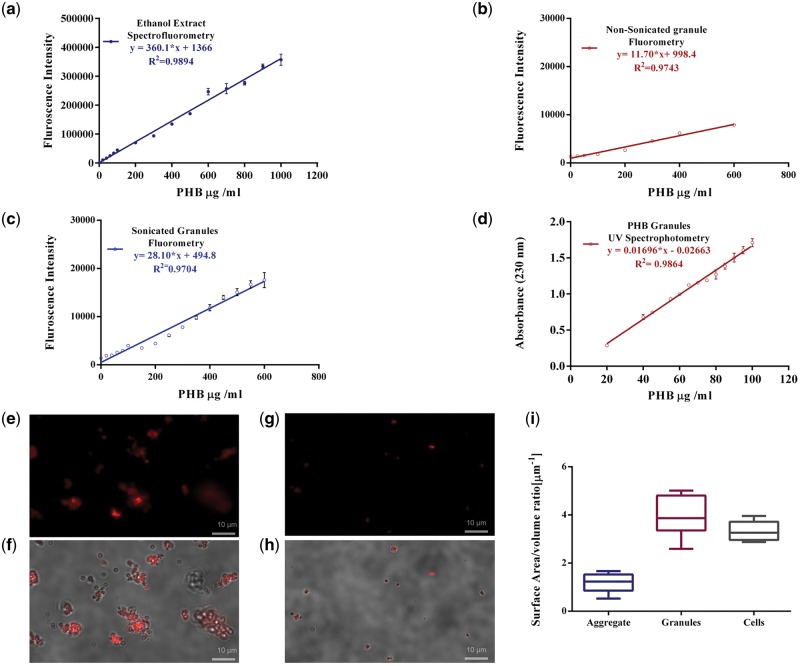
Development of analytical method for PHB. Calibration curves for PHB standard and physical parameters of standard PHB granules. (a) Spectrofluorometric calibration curve of ethanol extract from sonicated Nile red stained PHB standard granules in glycine-HCl buffer (excitation wavelength: 470 nm; emission wavelength: 640 nm) in the concentration range of 20 to 1000 μg/ml, (b) Spectrofluorometric calibration curve of ethanol extract from Nonsonicated Nile red stained PHB standard granules in glycine-HCl buffer (excitation wavelength: 470 nm; emission wavelength: 640 nm) in the concentration range of 25 to 600 μg/ml, (c) Spectrofluorometric Calibration curve for sonicated PHB granules stained with Nile red in Glycine HCl buffer using (excitation wavelength: 470 nm; emission wavelength: 600 nm) in the concentration range of 20 to 600 μg/ml, (d) calibration curve for PHB standards using crotonic acid based UV spectrophotometry (absorbance wavelenght: 230 nm) in concentration range of 20 to 100 μg/ml. Image panels depict Fluorescence microscopy and DIC images of Nile red stained granules incubated in glycine-HCl buffer for (e–f) nonsonicated PHB granules stained (g–h) sonicated PHB granules, (i) Differential surface area to volume ratios for nonsonicated aggregates, sonicated PHB granules and cells.

