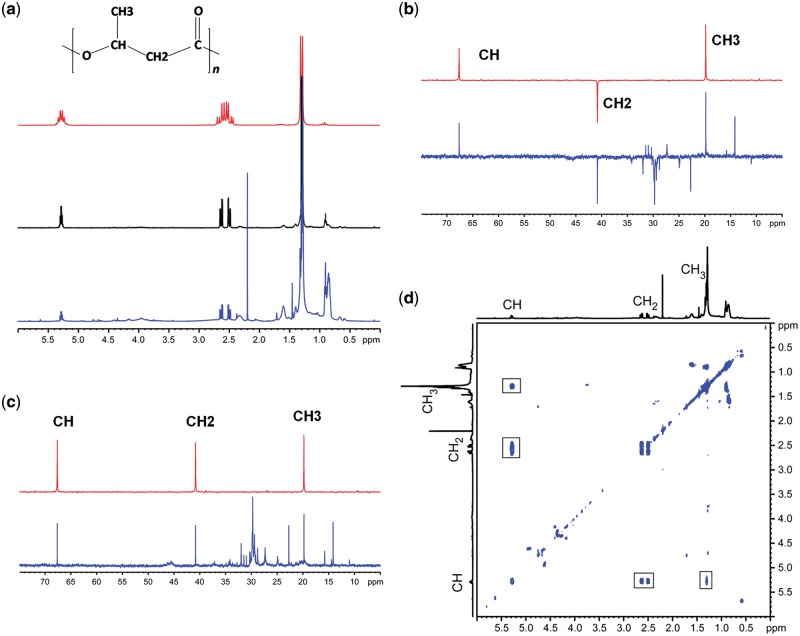
Figure 4:
NMR Spectroscopy for structural confirmation (a) 1H NMR spectrum of extract from recombinant E. coli grown on glycerol (blue, 500 MHz), diffusion filtered spectrum of the extract (Black, 500 MHz) and spectrum of PHB standard (Red, 200 MHz) in CDCl3 at 25C. The diffusion filtered spectrum selects signals from macromolecules and eliminates signals from low molecular weight species clearly shows the presence of PHB (b) DEPT spectra (c) 13C spectra of cell extract and PHB standard recorded on a 500 MHz spectrometer. Spectra of cell extract and PHB standard are show in blue and red, respectively. The different types of carbons in PHB are indicated (d) COSY spectrum peaks in 2D marked with square.

