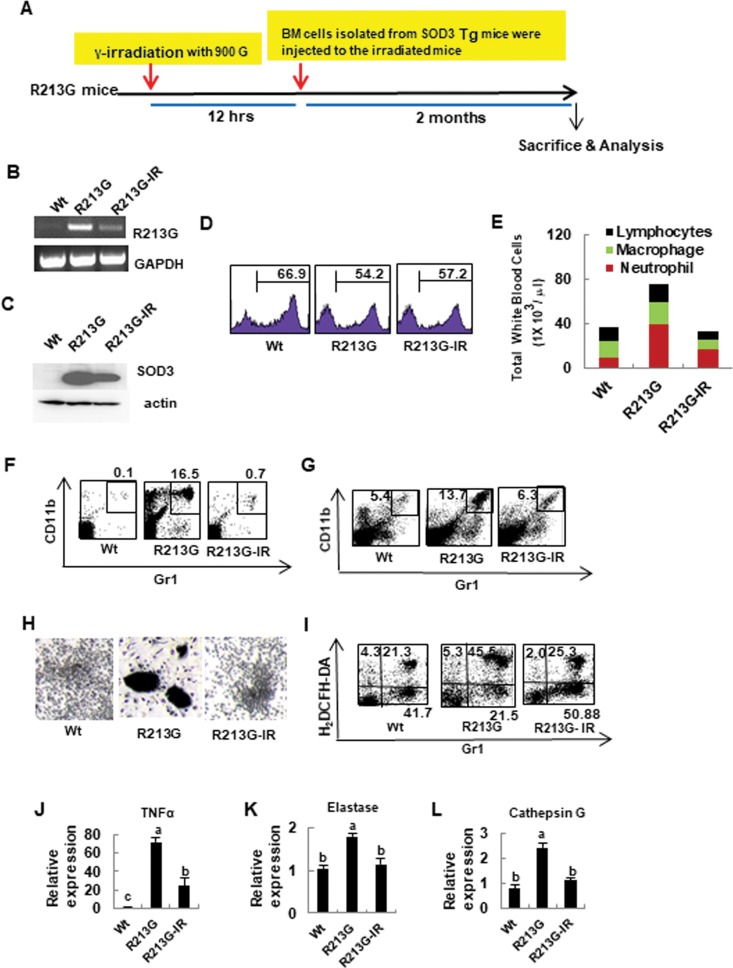
Fig 5. Aberrant neutrophils function of SOD3R213G mice is recovered by reconstitution with SOD3 expressing BM cells.
A. The scheme of BM reconstitution. Reconstitution of SOD3 expressing BM cells in SOD3R213G mice was described in Materials and Methods. B. The expression of SOD3R213G. SOD3R213G expression in neutrophils was assessed by RT-PCR as in Fig 4A. C. The protein expression of SOD3. The SOD3 protein expression in the BM neutrophils was assessed as described in materials and methods. D. The level of BM cells in transplanted SOD3R213G mice. Gr1+ BM cells were assessed as described in Materials and Methods. E. Cell profiles in the blood. The cell profiles, including lymphocytes, macrophages, and neutrophils are assessed as described in Materials and Methods. F and G. The contents of neutrophils in the peripheral blood and spleen. Gr1+CD11b+ neutrophils in the blood (F) and spleen (G) were assessed by FACS analysis as described in Fig 3A and 3D. H. Morphological changes of neutrophils. BM cells were isolated from 17 week old SOD3R213G, transplanted, and Wt mice, and treated with G-CSF as described in Materials and Methods. The morphological image was taken by light microscopy. Scale bar, 200 μm. I. Changes in ROS level. ROS generation was assessed by treatment with fMLP (100 nM, 1 hr) in the BM cells, and stained with H2DCFH-DA, 2’,7’-dichlorofluorescin diacetate (5 μM) with Gr1 and analyzed by FACS as described in Materials and Methods. J-L. Gene expressions of neutrophils in SOD3R213G mice. The expression of TNFα (J), elastase (K), and cathepsin G (L) in neutrophils was measured by qRT PCR. RT-PCR and FACS data are representative of at least three independent experiments. All qRT PCR data were analyzed as in Fig 1I–1M. Statistical analysis was performed by using ANOVA at p<0.05, followed by Scheffe’s post hoc test. R213G-IR represents transplanted SOD3R213G mice.

